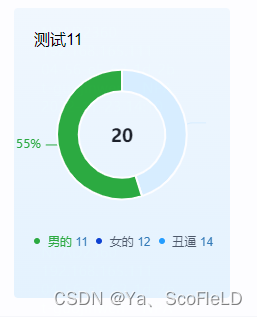
如图 产品有个需求是要做一个环形图 点击图例显示具体数字
但图例加起来是超过百分百的 如图 一个范围内有男有女有丑逼 点击男的显示男的 点击女的显示女的 并且显示占总数的百分比
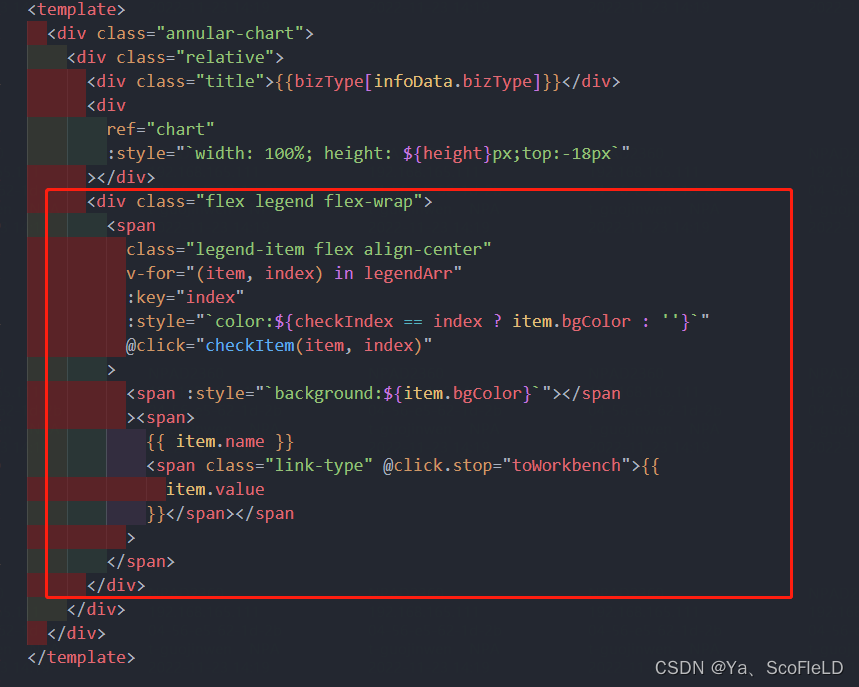
首先页面样式
引入环形图大家都会吧
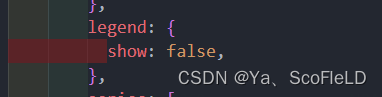
因为要自定义图例 所以隐藏图例
在图表下面自定义图例
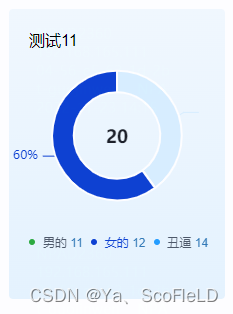
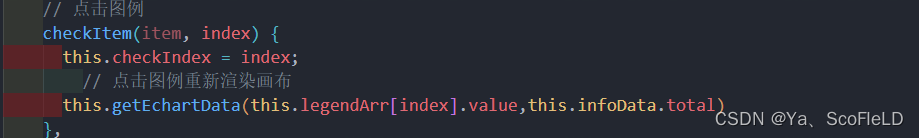
点击图例要将颜色改为对应的颜色 其他的为灰色
所以
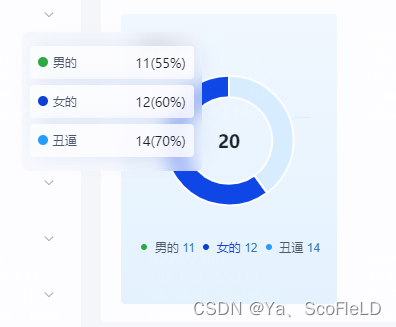
然后是鼠标移上去要显示全部的内容
所以在tooltip中formatter中自己写样式
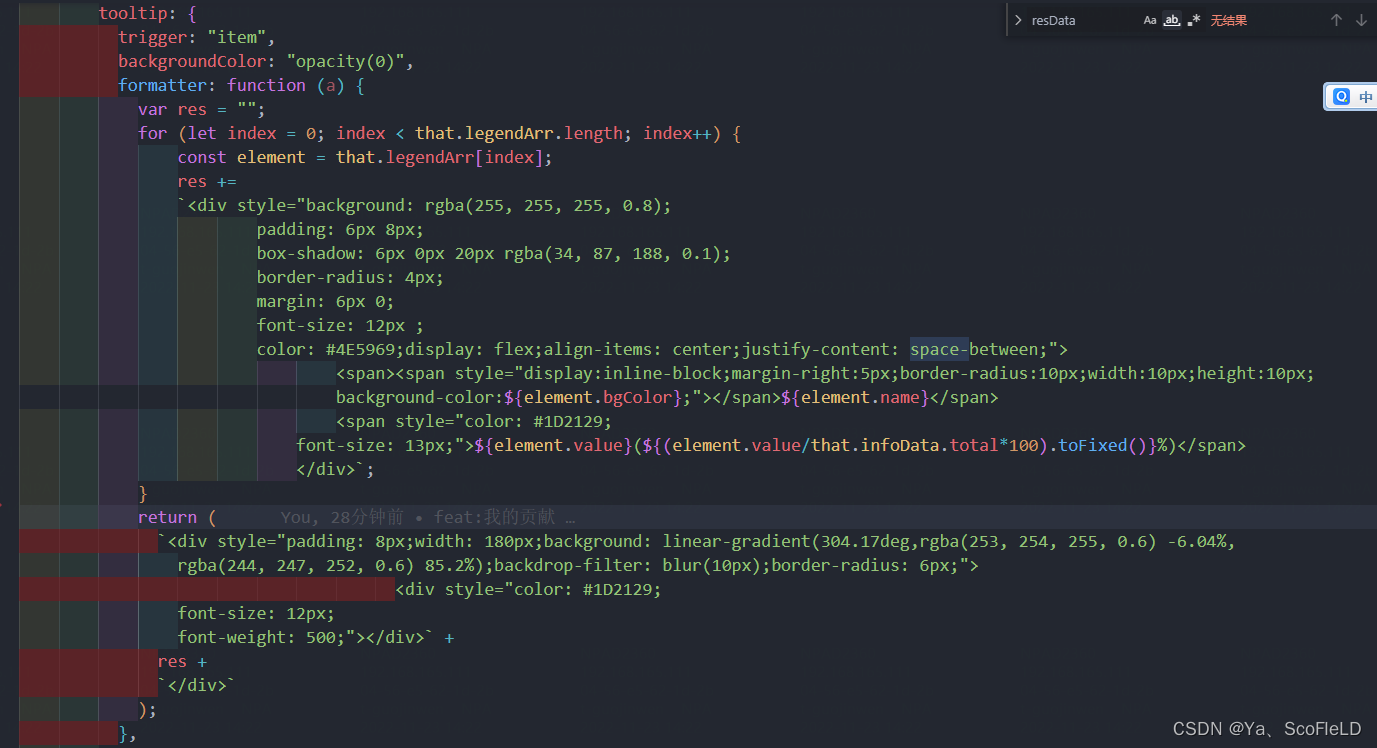
这是如图的样式 可以自己改
然后就是引导线的文字修改
因为我这边要显示百分比
所以
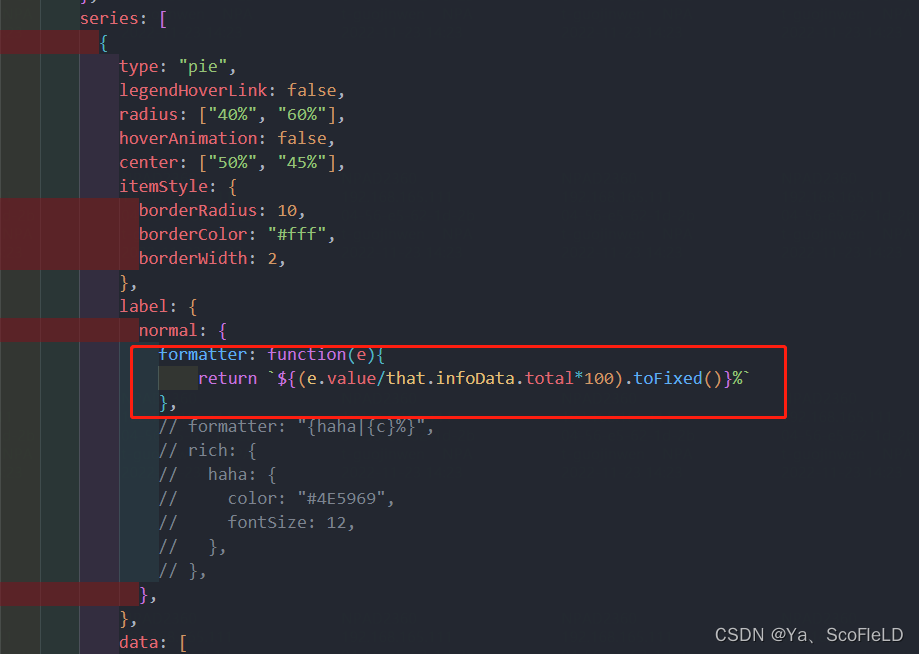
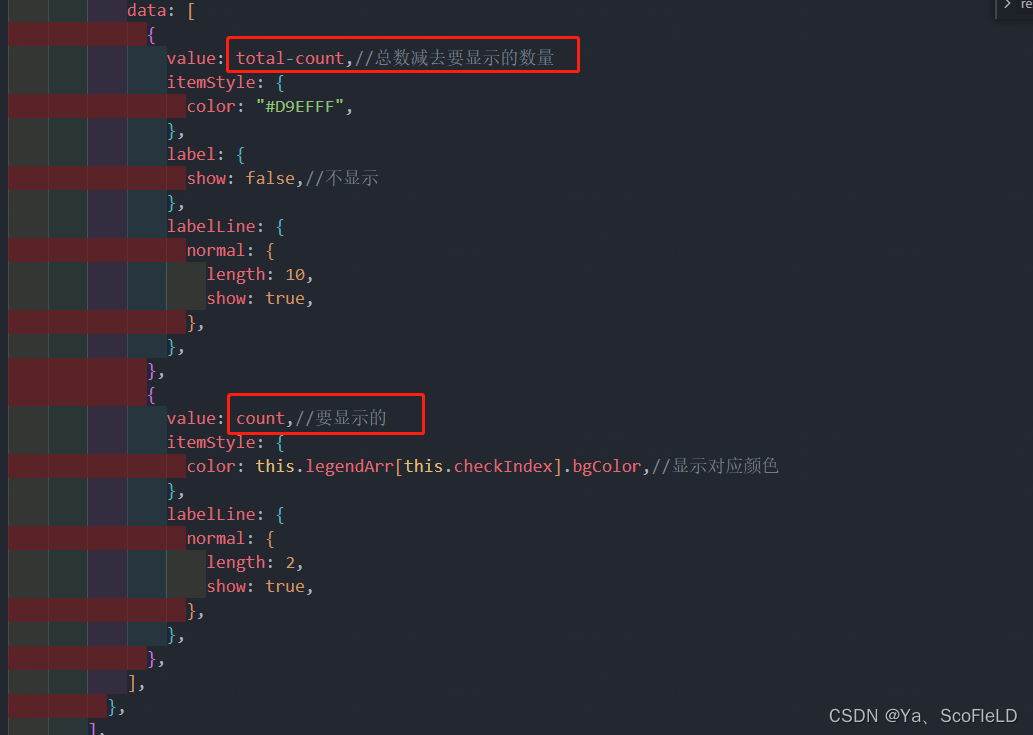
由于我这边想要的效果是只显示我选择的那个类型的数量 其他的为空 所以实际上就只有两块区域 一个是我们要显示的数量 剩下的部分就是总数减去我们要显示的数量的值 所以
至此完成
放完整代码
<template>
<div class="annular-chart">
<div class="relative">
<div class="title">{{bizType[infoData.bizType]}}</div>
<div
ref="chart"
:style="`width: 100%; height: ${height}px;top:-18px`"
></div>
<div class="flex legend flex-wrap">
<span
class="legend-item flex align-center"
v-for="(item, index) in legendArr"
:key="index"
:style="`color:${checkIndex == index ? item.bgColor : ''}`"
@click="checkItem(item, index)"
>
<span :style="`background:${item.bgColor}`"></span
><span>
{{ item.name }}
<span class="link-type" @click.stop="toWorkbench">{{
item.value
}}</span></span
>
</span>
</div>
</div>
</div>
</template>
<script>
const echarts = require("echarts/lib/echarts");
require("echarts/lib/component/title");
require("echarts/lib/component/tooltip");
require("echarts/lib/component/legend");
require("echarts/lib/chart/pie");
export default {
// import引入的组件需要注入到对象中才能使用
components: {},
props: {
height: {
type: Number,
default: 230,
},
infoData: {
type: Object,
default: () => {},
},
},
data() {
// 这里存放数据
return {
checkIndex: 0,
legendArr: [],
bizType:{
collect:'测试11',
req:'测试22'
}
};
},
// 监听属性 类似于data概念
computed: {},
// 监控data中的数据变化
watch: {},
// 方法集合
methods: {
toWorkbench() {
console.log("跳转");
},
// 点击图例
checkItem(item, index) {
this.checkIndex = index;
// 点击图例重新渲染画布
this.getEchartData(this.legendArr[index].value,this.infoData.total)
},
getEchartData(count,total) {
const that=this;
const chart = this.$refs.chart;
var myChart = echarts.init(chart);
var option = {
title: {
text: this.infoData.total,
// // 副标题
// subtext: this.infoData.optionSubtext,
// 主副标题间距
x: "center",
y: "center",
top: "40%",
// 主标题样式
textStyle: {
fontSize: "18",
color: "#1D2129",
},
// 副标题样式
subtextStyle: {
fontSize: "12",
color: "#4E5969",
},
},
tooltip: {
trigger: "item",
backgroundColor: "opacity(0)",
formatter: function (a) {
var res = "";
for (let index = 0; index < that.legendArr.length; index++) {
const element = that.legendArr[index];
res +=
`<div style="background: rgba(255, 255, 255, 0.8);
padding: 6px 8px;
box-shadow: 6px 0px 20px rgba(34, 87, 188, 0.1);
border-radius: 4px;
margin: 6px 0;
font-size: 12px ;
color: #4E5969;display: flex;align-items: center;justify-content: space-between;">
<span><span style="display:inline-block;margin-right:5px;border-radius:10px;width:10px;height:10px;background-color:${element.bgColor};"></span>${element.name}</span>
<span style="color: #1D2129;
font-size: 13px;">${element.value}(${(element.value/that.infoData.total*100).toFixed()}%)</span>
</div>`;
}
return (
`<div style="padding: 8px;width: 180px;background: linear-gradient(304.17deg,rgba(253, 254, 255, 0.6) -6.04%,
rgba(244, 247, 252, 0.6) 85.2%);backdrop-filter: blur(10px);border-radius: 6px;">
<div style="color: #1D2129;
font-size: 12px;
font-weight: 500;"></div>` +
res +
`</div>`
);
},
},
legend: {
show: false,
},
series: [
{
type: "pie",
legendHoverLink: false,
radius: ["40%", "60%"],
hoverAnimation: false,
center: ["50%", "45%"],
itemStyle: {
borderRadius: 10,
borderColor: "#fff",
borderWidth: 2,
},
label: {
normal: {
formatter: function(e){
return `${(e.value/that.infoData.total*100).toFixed()}%`
},
// formatter: "{haha|{c}%}",
// rich: {
// haha: {
// color: "#4E5969",
// fontSize: 12,
// },
// },
},
},
data: [
{
value: total-count,//总数减去要显示的数量
itemStyle: {
color: "#D9EFFF",
},
label: {
show: false,//不显示
},
labelLine: {
normal: {
length: 10,
show: true,
},
},
},
{
value: count,//要显示的
itemStyle: {
color: this.legendArr[this.checkIndex].bgColor,//显示对应颜色
},
labelLine: {
normal: {
length: 2,
show: true,
},
},
},
],
},
],
};
option && myChart.setOption(option);
// 图例点击事件
// myChart.on("legendSelectchanged", function (params) {
// console.log("legend被点击", params);
// console.log(8800, option);
// let name = params.name;
// that.infoData.optionData.forEach((item,index) => {
// if(item.name==name){
// option.series[0].data[index].itemStyle.color=item.checkedColor
// }else{
// option.series[0].data[index].itemStyle.color=that.infoData.defaultBgColor
// }
// });
// myChart.dispatchAction({
// type: "legendSelect",
// name: params.name,
// });
// myChart.setOption(option);
// });
// 鼠标悬浮时不改变环形颜色
// myChart.on("mouseover", (e) => {
// myChart.dispatchAction({
// type: "downplay",
// seriesIndex: 0,
// dataIndex: e.dataIndex,
// color: e.color,
// });
// myChart.setOption(option);
// });
},
},
// 生命周期 - 创建完成(可以访问当前this实例)
created() {},
// 生命周期 - 挂载完成(可以访问DOM元素)
mounted() {
this.legendArr = this.infoData.arr.map((o) => ({
name: o.label,
value: o.count,
bgColor: o.color,
}));
this.getEchartData(this.legendArr[this.checkIndex].value,this.infoData.total);
},
// 这里存放数据
beforeCreate() {},
// 生命周期 - 挂载之前
beforeMount() {},
// 生命周期 - 更新之前
beforeUpdate() {},
// 生命周期 - 更新之后
updated() {},
// 生命周期 - 销毁之前
beforeDestroy() {},
// 生命周期 - 销毁完成
destroyed() {},
// 如果页面有keep-alive缓存功能,这个函数会触发
activated() {},
};
</script>
<style lang='scss' scoped>
.annular-chart {
  //   padding: 10px;
  // position: relative;
  background: linear-gradient(180deg, #f2f9fe 0%, #e6f4fe 100%);
  border-radius: 4px;
  width: 216px;
  height: 290px;
  .title {
    padding: 20px 20px 0;
  }
  .legend {
    position: absolute;
    top: 225px;
    left: 20px;
    font-size: 12px;
    color: #4e5969;
    .legend-item {
      margin-right: 8px;
      margin-bottom: 4px;
      cursor: pointer;
      > :first-child {
        display: inline-block;
        width: 6px;
        height: 6px;
        border-radius: 50%;
        background: #f00;
        margin-right: 8px;
      }
    }
  }
}
// @import url(); 引入公共css类
</style>
原文地址:https://blog.csdn.net/TAAAAAB/article/details/127999476
本文来自互联网用户投稿,该文观点仅代表作者本人,不代表本站立场。本站仅提供信息存储空间服务,不拥有所有权,不承担相关法律责任。
如若转载,请注明出处:http://www.7code.cn/show_39542.html
如若内容造成侵权/违法违规/事实不符,请联系代码007邮箱:suwngjj01@126.com进行投诉反馈,一经查实,立即删除!
主题授权提示:请在后台主题设置-主题授权-激活主题的正版授权,授权购买:RiTheme官网
声明:本站所有文章,如无特殊说明或标注,均为本站原创发布。任何个人或组织,在未征得本站同意时,禁止复制、盗用、采集、发布本站内容到任何网站、书籍等各类媒体平台。如若本站内容侵犯了原著者的合法权益,可联系我们进行处理。