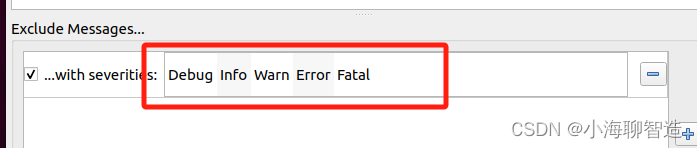
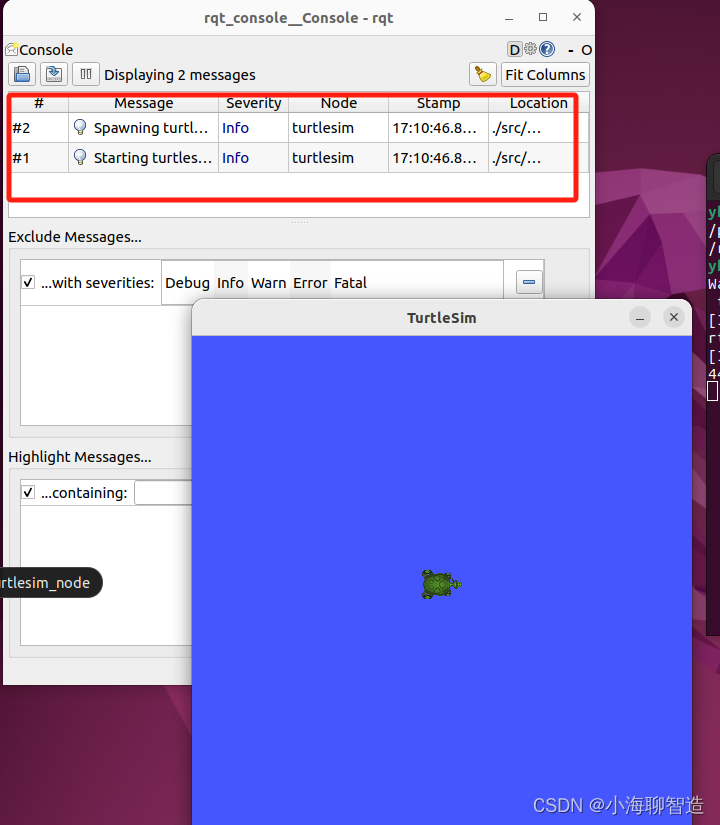
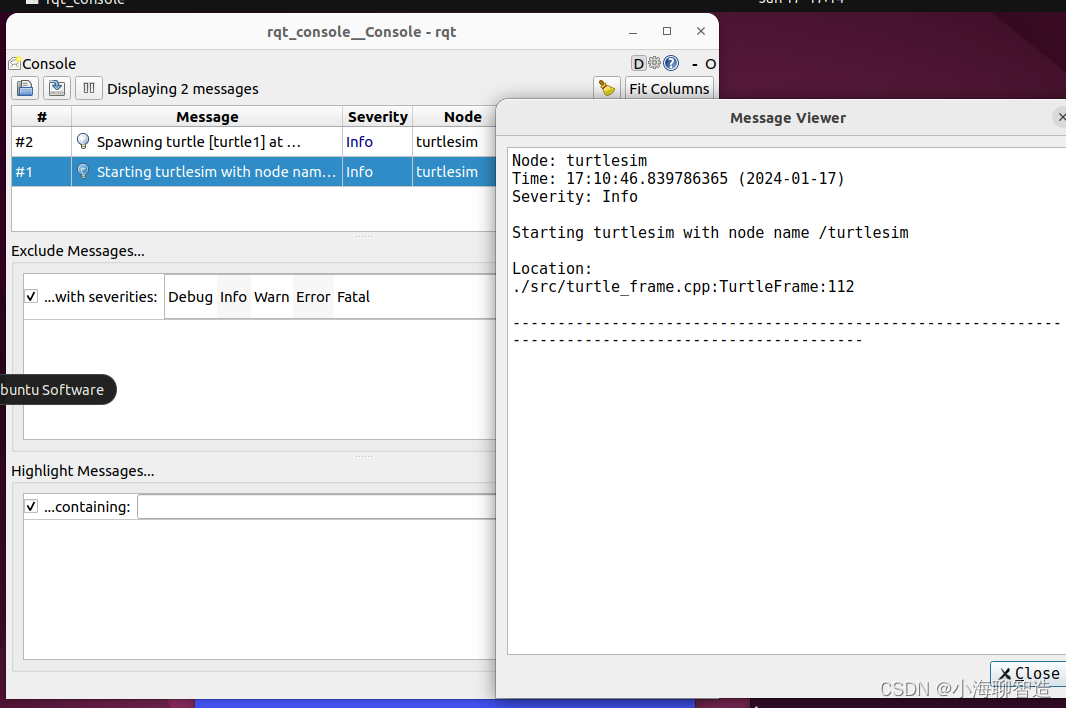
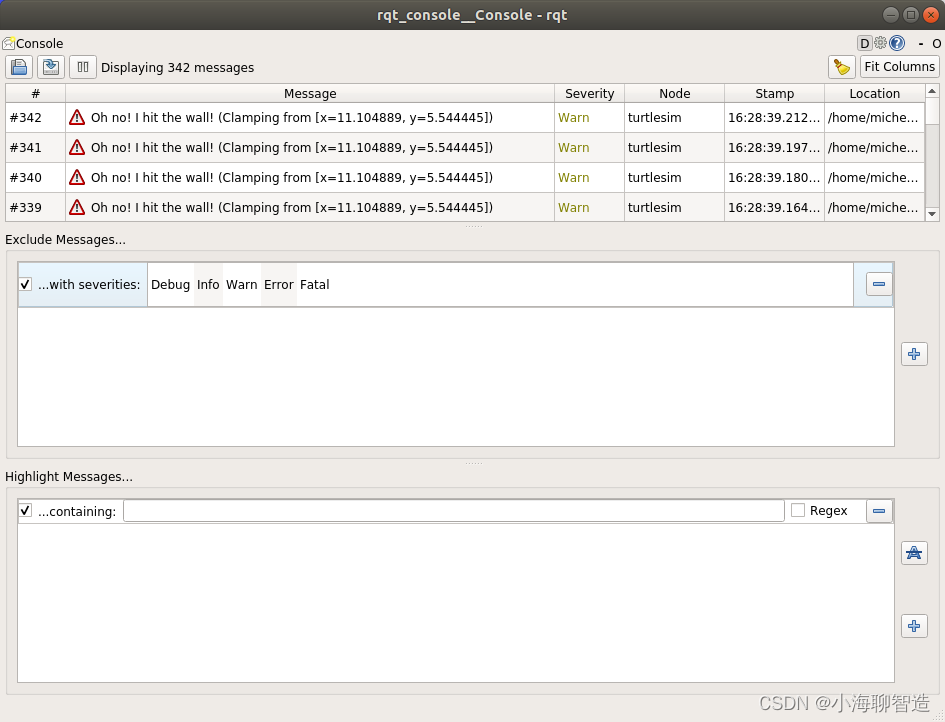
本文介绍: 正如RQT的命名,它和Rviz一样,也是基于QT可视化工具开发而来,在使用前,我们需要通过这样一句指令进行安装,然后就可以通过rqt这个命令启动使用了。安装注意自己ros2 的版本,我的是humble启动rqt启动成功后如图里边可以加载很多小模块,每个模块都可以实现一个具体的小功能,一些常用的功能如下:日志显示:也可以通过命令行方式启动从启动的界面可以看到有三个部分Console用来过滤日志等级的…:自定义过滤现在我们新开命令窗口,启动一个小乌龟节点。
RQT:模块化可视化工具
此时,我们就会用到ROS提供的另外一种模块化可视化工具——rqt。
rqt介绍
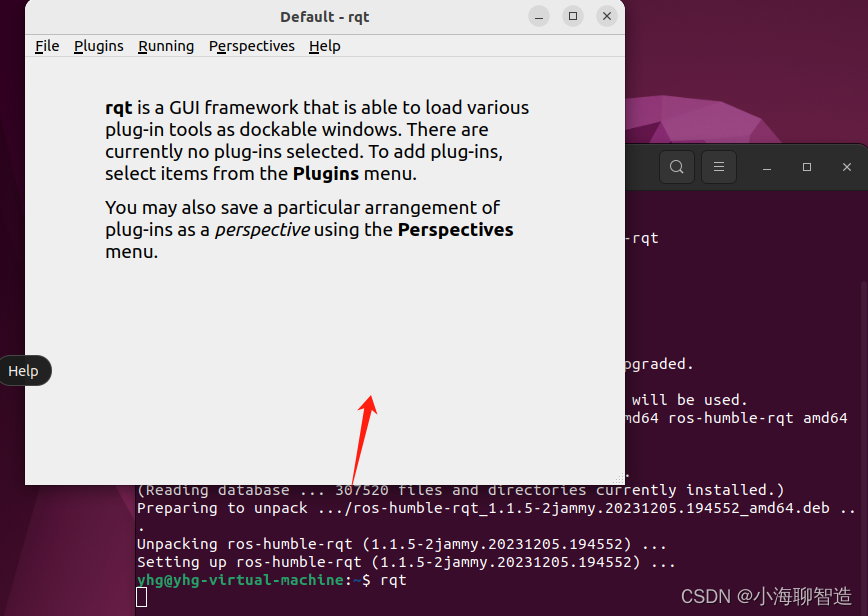
正如RQT的命名,它和Rviz一样,也是基于QT可视化工具开发而来,在使用前,我们需要通过这样一句指令进行安装,然后就可以通过rqt这个命令启动使用了。
安装
注意自己ros2 的版本,我的是humble
启动
启动成功后如图


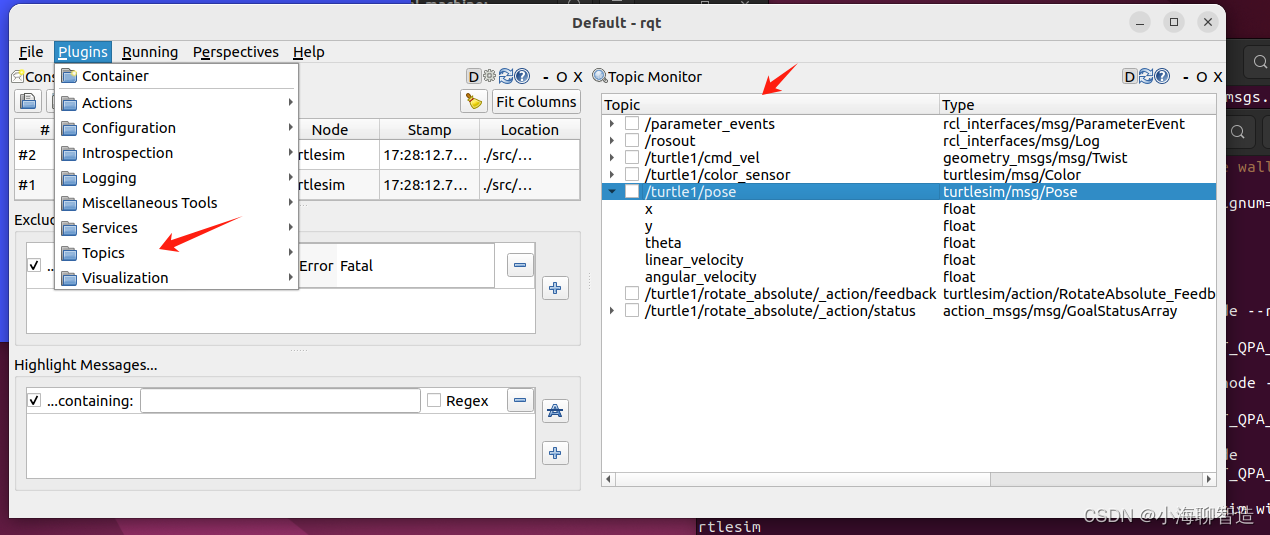
查看当前所有的topic 列表
发布话题数据/调用服务请求

数据包管理

节点可视化

查看节点和节点之间的关系

启动 Service 服务

刷新服务列表
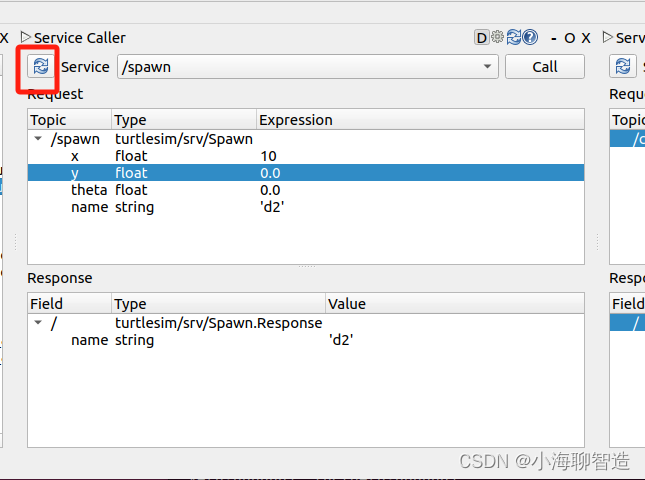
调整调用服务的参数

启动服务

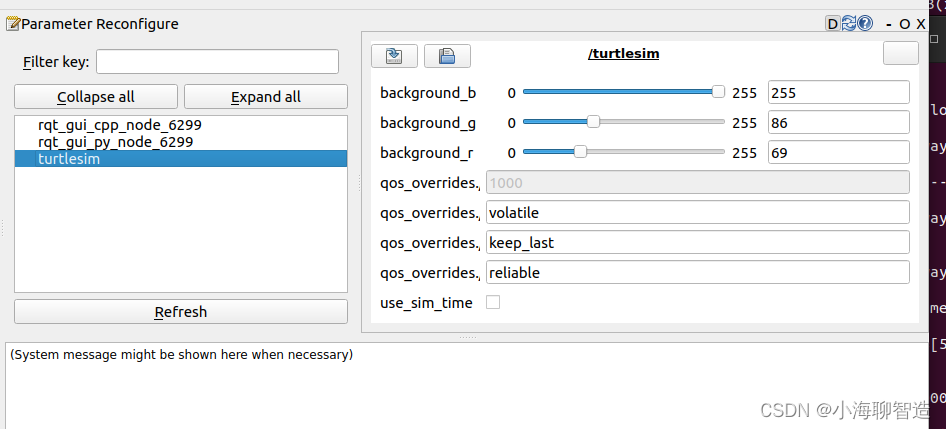
查看设置节点服务的参数

声明:本站所有文章,如无特殊说明或标注,均为本站原创发布。任何个人或组织,在未征得本站同意时,禁止复制、盗用、采集、发布本站内容到任何网站、书籍等各类媒体平台。如若本站内容侵犯了原著者的合法权益,可联系我们进行处理。