本文介绍: 在业务开发中需要绘制数据流向图,由于echarts关系图的限制以及需求的特殊要求,转而使用antv/g6实现,本文以代码的方式实现数据流向需求以及节点分组,版本”@antv/g6″: “^4.8.24”,more本文主要列出关键性的代码,并非全部代码。
前言
在业务开发中需要绘制数据流向图,由于echarts关系图的限制以及需求的特殊要求,转而使用antv/g6实现,本文以代码的方式实现数据流向需求以及节点分组,版本”@antv/g6″: “^4.8.24”,
本文主要列出关键性的代码,并非全部代码
接口模拟数据
getCenterFlowG6ApiV2(data = {}) {
    return new Promise((resolve) => {
      let nodes: any = []
      for (let i = 1; i <= 14; i++) {
        let node: any = { id: "node-" + i, label: "node-" + i }
        if (i % 3 === 0) {
          node.class = "c0"
        } else if (i % 3 === 1) {
          node.class = "c1"
        } else if (i % 3 === 2) {
          node.class = "c2"
        }
        nodes.push(node)
      }

      const res = {
        "resultStat": "0",
        "failCode": null,
        "mess": "获取流向成功",
        "callBack": null,
        "data": {
          nodes: [
            {
              id: "4",
              label: "业务数据库A",
              comboId:"group0",
              imgType:"14",
              "pointNodeDetail": {
                "nodeName": "武汉关",
                "nodeTypeName": "应用安全域",
                "areaName": "武汉关",
                "areaIpScope": "160.1.1.1-255.255.255.255",
                "areaBelong": "tanzhi",
                "areaType": "办公网接入域"
              },
            }, {
              id: "8",
              label: "业务数据库B",
              comboId:"group1",
              imgType:"10"
            },{
              id: "10",
              label: "主机166.10.1.1",
              comboId:"group2"
            },{
              id: "12",
              label: "主机161.19.1.4",
              comboId:"group4"
            }, {
              id: "14",
              label: "业务数据库B",
              comboId:"group3"
            }
          ],
          edges: [
            {
              eid: "4-8",
              source: "4",
              target: "8",
            },{
              eid: "8-4",
              source: "8",
              target: "4",
            },{
              eid: "10-4",
              source: "10",
              target: "4",
            },{
              eid: "10-8",
              source: "10",
              target: "8",
            },{
              eid: "12-8",
              source: "12",
              target: "8",
              style:{
                stroke: 'red', // 线的颜色
              }
            },{
              eid: "4-14",
              source: "4",
              target: "14",
            }
          ],
          combos: [
            {
              id:'group0',
              label:'信息中心',
              collapsed: true,// 初始时,收起,不展示内部节点
              style:{
                fill: "r(0.5,0.5,0.9) 0.6:#f8fcff 1:#3b97f1",
                opacity: 0.2
              }
            },
            {
              id:'group1',
              label:'数据分析中心',
              parentId:'group0',
              collapsed: true,
              style:{
                fill:"#FCCBAE"
              }
            },
            {
              id:'group2',
              label:'数据采集',
              collapsed: true,
              style:{
                fill:"#ECF7CF"
              }
            },
            {
              id:'group3',
              label:'业务办公区',
              parentId:'group0',
              collapsed: true,
              style:{
                fill:"#CECFD1"
              }
            },
            {
              id:'group4',
              label:'某地海关',
              collapsed: true,
              style:{
                fill:"#D1E9FF"
              }
            }
          ]
        },
        "redirectURL": null,
        "total": null
      }
      resolve(res)
    })
  }
html
<div class="echart-box">
    <div class="chart1" id="charts1" *ngIf="chartData.data != null && !pageLoading" ></div>
</div>
ts
import G6 from "@antv/g6"
import equipment from "../../../../assets/equipment.png"
import equipmentE from "../../../../assets/equipmentE.png"
import equipmentY from "../../../../assets/equipmentY.png"
import application from "../../../../assets/application.png"
import assetsE from "../../../../assets/assetsE.png"
import assetsY from "../../../../assets/assetsY.png"
import assets from "../../../../assets/assets.png"
import domain from "../../../../assets/domain.png"
import domainE from "../../../../assets/domainE.png"
import domainY from "../../../../assets/domainY.png"
import warning from "../../../../assets/warning.png"
import warningY from "../../../../assets/warningY.png"
import clusterAsset from "../../../../assets/clusterAsset.png"
import clusterAssetY from "../../../../assets/clusterAssetY.png"
import clusterAssetR from "../../../../assets/clusterAssetR.png"
import belongCenterY from "../../../../assets/belongCenterY.png"
import belongCenter from "../../../../assets/belongCenter.png"
import belongCenterR from "../../../../assets/belongCenterR.png"
import netDomain from "../../../../assets/netDomain.png"
import netDomainR from "../../../../assets/netDomainR.png"
import netDomainY from "../../../../assets/netDomainY.png"
import groupIcon from "../../../../assets/chart/img/g6/群组_02.png";
/**
* 加载流向图
*/
getDataFlow() {
this.pageLoading = true
this.apiService.getCenterFlowG6ApiV2(removeNullProperty({
...this.q
})).then((res: resType) => {
console.log(res);
if (res.resultStat === "0") {
this.chartData.data = this.transformData(res.data)
console.log(this.chartData.data);
setTimeout(() => {
this.initG6DataFlow(this.chartData.data)
}, 300);
}
this.pageLoading = false
}).catch(err => {
this.pageLoading = false
})
}
initG6DataFlow(data) {
let rectWidth = 800
let rectHeight = 600
const eContainer = document.getElementById("charts1")
if (eContainer) {
if (data.nodes.length < 100) {
eContainer.style.height = '100%' // 600px
eContainer.style.minHeight = '600px' // 600px
eContainer.style.width = '100%' // 800px
} else {
eContainer.style.height = '1080px'
eContainer.style.width = '1920px'
}
const rectObject = eContainer.getBoundingClientRect()
rectWidth = rectObject.right - rectObject.left
rectHeight = rectObject.bottom - rectObject.top;
console.log(rectObject);
console.log(rectWidth, rectHeight);
}
const graph = new G6.Graph({
container: 'charts1', // String | HTMLElement,必须,在 Step 1 中创建的容器 id 或容器本身
width: rectWidth - 10, // Number,必须,图的宽度
height: rectHeight - 10, // Number,必须,图的高度
fitView: false, // 将图适配到画布
fitViewPadding: 50, // 画布四周留白宽度
// 必须将 groupByTypes 设置为 false,带有 combo 的图中元素的视觉层级才能合理
groupByTypes: false,
fitCenter: true,
linkCenter: false,
//autoPaint: true,
layout: {
type: 'comboCombined',
spacing: 20,
comboPadding: 5
},
modes: {
// 允许拖拽画布、放缩画布、拖拽节点,
default: [
'drag-canvas',
'zoom-canvas',
{
type: 'drag-node',
onlyChangeComboSize: true,
},
{
type: "drag-combo",
enableDelegate: false,
onlyChangeComboSize: true,
},
{
type: 'collapse-expand-combo',
trigger: 'click',
relayout: false, // 收缩展开后,不重新布局
},
{
type: 'tooltip', // 提示框
formatText(model) {
// 提示框文本内容
const text = 'label: ' + model.label + '<br/> class: ' + model.class;
return text;
},
shouldUpdate: e => {
return true;
}
},
{
type: 'edge-tooltip', // 边提示框
formatText(model) {
// 边提示框文本内容
const text =
'source: ' +
model.source +
'<br/> target: ' +
model.target +
'<br/> weight: ' +
(model.weight || "");
return text;
},
shouldUpdate: e => {
return true;
}
}
],
},
defaultNode: {// 默认状态下的节点配置
size: 30,
// 节点样式配置
style: {
fill: 'steelblue', // 节点填充色
stroke: '#666', // 节点描边色
lineWidth: 2, // 节点描边粗细
},
// 节点上的标签文本配置
labelCfg: {
// 节点上的标签文本样式配置
style: {
fill: '#333', // 节点标签文字颜色
stroke: '#fff',
},
position:"bottom"
},
},
defaultEdge: {// 默认状态下的边配置
style: {
//opacity: 0.6, // 边透明度
lineWidth: 4, // 线宽
stroke: '#D6ECF3', // 线的颜色
//endArrow: true,// 默认箭头
endArrow: { // 自定义终点箭头
path: G6.Arrow.vee(5, 10, 10), // 使用内置箭头路径函数,参数为箭头的 宽度、长度、偏移量(默认为 0,与 d 对应)
d: 10
}
},
// 边上的标签文本配置
labelCfg: {
autoRotate: true, // 边上的标签文本根据边的方向旋转
refY: 10,
},
},
defaultCombo: {
collapsed: true,
padding:5,
labelCfg:{
"style": {
"fontSize": 12,
"fill": "r(0.5,0.5,0.1) 0:#ffffff 1:#555555",
"opacity": 1,
"stroke": "#fff",
"lineWidth": 1,
"fontFamily": "微软雅黑",
"text": "信息中心"
},
"position": "top"
},
collapsedSubstituteIcon: { // 群组收起时的图标
show: true,
img: groupIcon,
height: 30,
width: 30,
},
},
// 节点不同状态下的样式集合
nodeStateStyles: {
// 鼠标 hover 上节点,即 hover 状态为 true 时的样式
hover: {
fill: 'lightsteelblue',
},
// 鼠标点击节点,即 click 状态为 true 时的样式
click: {
stroke: '#000',
lineWidth: 3,
},
},
// 边不同状态下的样式集合
edgeStateStyles: {
// 鼠标点击边,即 click 状态为 true 时的样式
click: {
stroke: 'steelblue',
},
},
});
if (this.chartData.instance) {
this.chartData.instance.destroy()
}
this.chartData.instance = graph
graph.data(data); // 读取 Step 2 中的数据源到图上
graph.render(); // 渲染图
graph.get('canvas').set('localRefresh', false)
// 监听鼠标进入节点
graph.on('node:mouseenter', (e) => {
const nodeItem = e.item;
// 设置目标节点的 hover 状态 为 true
graph.setItemState(nodeItem, 'hover', true);
});
// 监听鼠标离开节点
graph.on('node:mouseleave', (e) => {
const nodeItem = e.item;
// 设置目标节点的 hover 状态 false
graph.setItemState(nodeItem, 'hover', false);
});
// 监听鼠标点击节点
graph.on('node:click', (e) => {
console.log(e);
this.pointNodeDetail = e.item._cfg.model.pointNodeDetail
// 先将所有当前有 click 状态的节点的 click 状态置为 false
const clickNodes = graph.findAllByState('node', 'click');
clickNodes.forEach((cn) => {
graph.setItemState(cn, 'click', false);
});
const nodeItem = e.item;
// 设置目标节点的 click 状态 为 true
graph.setItemState(nodeItem, 'click', true);
});
// 监听鼠标点击节点
graph.on('edge:click', (e) => {
// 先将所有当前有 click 状态的边的 click 状态置为 false
const clickEdges = graph.findAllByState('edge', 'click');
clickEdges.forEach((ce) => {
graph.setItemState(ce, 'click', false);
});
const edgeItem = e.item;
// 设置目标边的 click 状态 为 true
graph.setItemState(edgeItem, 'click', true);
});
}
/**
* 对接口数据进行加工
*/
transformData(data) {
for (let i = 0; i < data.nodes.length; i++) {
let node = data.nodes[i]
console.log(node);
if (!node.style) {
node.style = {}
}
switch (
node.class // 根据节点数据中的 class 属性配置图形
) {
case 'c0': {
node.type = 'circle'; // class = 'c0' 时节点图形为 circle
break;
}
case 'c1': {
debugger
node.type = 'rect'; // class = 'c1' 时节点图形为 rect
node.size = [35, 20]; // class = 'c1' 时节点大小
break;
}
case 'c2': {
node.type = 'ellipse'; // class = 'c2' 时节点图形为 ellipse
node.size = [35, 20]; // class = 'c2' 时节点大小
break;
}
}
if(node.imgType){
this.transNodeImg(node)
}
}
return data
}
/**
* 根据类型设置image图标
* @param node
*/
transNodeImg(node) {
node.type = 'image';
node.size = 30
switch (
node.imgType // 根据节点数据中的 class 属性配置图形
) {
case '1': {
node.img = domain
break;
}
case '2': {
node.img = equipment
break;
}
case '3': {
node.img = assets
break;
}
case '4': {
node.img = application
break;
}
case '5': {
node.img = domainY
break;
}
case '6': {
node.img = equipmentY
break;
}
case '7': {
node.img = assetsY
break;
}
case '8': {
node.img = warningY
break;
}
case '9': {
node.img = domainE
break;
}
case '10': {
node.img = equipmentE
break;
}
case '11': {
node.img = assetsE
break;
}
case '12': {
node.img = warning
break;
}
case '13': {
node.img = clusterAsset
break;
}
case '14': {
node.img = belongCenter
break;
}
case '15': {
node.img = belongCenter
break;
}
case '16': {
node.img = netDomain
break;
}
case '17': {
node.img = clusterAssetY
break;
}
case '18': {
node.img = belongCenterY
break;
}
case '19': {
node.img = belongCenterY
break;
}
case '20': {
node.img = netDomainY
break;
}
case '21': {
node.img = clusterAssetR
break;
}
case '22': {
node.img = belongCenterR
break;
}
case '23': {
node.img = belongCenterR
break;
}
case '24': {
node.img = netDomainR
break;
}
}
}
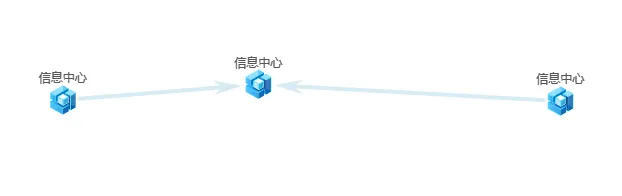
页面效果


原文地址:https://blog.csdn.net/weixin_43863895/article/details/135790807
本文来自互联网用户投稿,该文观点仅代表作者本人,不代表本站立场。本站仅提供信息存储空间服务,不拥有所有权,不承担相关法律责任。
如若转载,请注明出处:http://www.7code.cn/show_61325.html
如若内容造成侵权/违法违规/事实不符,请联系代码007邮箱:suwngjj01@126.com进行投诉反馈,一经查实,立即删除!
主题授权提示:请在后台主题设置-主题授权-激活主题的正版授权,授权购买:RiTheme官网
声明:本站所有文章,如无特殊说明或标注,均为本站原创发布。任何个人或组织,在未征得本站同意时,禁止复制、盗用、采集、发布本站内容到任何网站、书籍等各类媒体平台。如若本站内容侵犯了原著者的合法权益,可联系我们进行处理。