当你的项目中因数据量太大,导致柱状图数据全部叠在一起不便于看的时候,你们是怎么处理的?
大部分同学可能第一想法就是裁剪一部分数据,仅展示页面最大限度能够展示的数据,这确实是一个好办法,简单快速。但有时候怎么展示是要根据业务需求来定的,如果你的业务不能满足截取的需求,必须要展示超出这个范围的数据量,那应该怎么办呢?
此时还有一部分同学会提出使用滚动条,这样不就能够展示更多的数据了吗?但又面临一个问题,具体应该怎么使用呢?
接下来我就上面如何使用滚动条的问题贴一下自己的一点点配置技巧,希望对大家有所帮助。
//参考:http://chartlib.datains.cn/detail?id=0e2474b7044f44ff97b51d1d67450f15
var datas = [
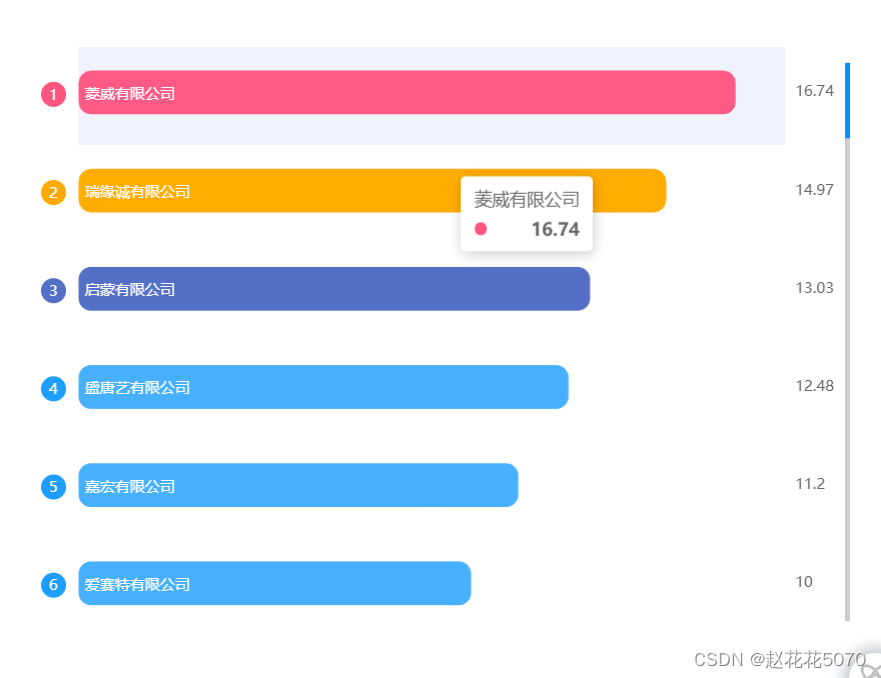
{ ranking: 1, station: '菱威有限公司', value: 16.74 },
{ ranking: 2, station: '瑞缘诚有限公司', value: 14.97 },
{ ranking: 3, station: '启蒙有限公司', value: 13.03 },
{ ranking: 4, station: '盛唐艺有限公司', value: 12.48 },
{ ranking: 5, station: '嘉宏有限公司', value: 11.20 },
{ ranking: 6, station: '爱赛特有限公司', value: 10.00 },
{ ranking: 7, station: '浩威有限公司', value: 8.20 },
{ ranking: 8, station: '美威有限公司', value: 7.20 },
{ ranking: 9, station: '安图山地有限公司', value: 6.20 },
{ ranking: 10, station: '天城陆风有限公司', value: 5.20 },
{ ranking: 11, station: '天城陆风有限公司', value: 5.20 },
{ ranking: 12, station: '天城陆风有限公司', value: 5.20 },
{ ranking: 13, station: '天城陆风有限公司', value: 5.20 },
{ ranking: 14, station: '天城陆风有限公司', value: 5.20 },
{ ranking: 15, station: '天城陆风有限公司', value: 5.20 },
{ ranking: 16, station: '天城陆风有限公司', value: 5.20 },
{ ranking: 17, station: '天城陆风有限公司', value: 5.20 },
{ ranking: 18, station: '天城陆风有限公司', value: 5.20 },
{ ranking: 19, station: '天城陆风有限公司', value: 5.20 },
{ ranking: 20, station: '天城陆风有限公司', value: 5.20 },
{ ranking: 21, station: '天城陆风有限公司', value: 5.20 },
{ ranking: 22, station: '天城陆风有限公司', value: 5.20 },
{ ranking: 23, station: '天城陆风有限公司', value: 5.20 },
{ ranking: 24, station: '天城陆风有限公司', value: 5.20 },
{ ranking: 25, station: '天城陆风有限公司', value: 5.20 },
{ ranking: 26, station: '天城陆风有限公司', value: 5.20 },
{ ranking: 27, station: '天城陆风有限公司', value: 5.20 },
{ ranking: 28, station: '天城陆风有限公司', value: 5.20 },
{ ranking: 29, station: '天城陆风有限公司', value: 5.20 },
{ ranking: 30, station: '天城陆风有限公司', value: 5.20 },
{ ranking: 31, station: '天城陆风有限公司', value: 5.20 },
{ ranking: 32, station: '天城陆风有限公司', value: 5.20 },
{ ranking: 33, station: '天城陆风有限公司', value: 5.20 },
{ ranking: 34, station: '天城陆风有限公司', value: 5.20 },
{ ranking: 35, station: '天城陆风有限公司', value: 5.20 },
{ ranking: 36, station: '天城陆风有限公司', value: 5.20 },
{ ranking: 37, station: '天城陆风有限公司', value: 5.20 },
{ ranking: 38, station: '天城陆风有限公司', value: 5.20 },
];
var seriesName = ['2023年出口额','2022年出口额'];
var attackSourcesColor1 = ['#FF557F','#FFAA00','#5470C6','#1E9FFF'];
function contains(arr, dst) {
var i = arr.length;
while ((i -= 1)) {
if (arr[i] == dst) {
return i;
}
}
return false;
}
var attackSourcesColor = [
new echarts.graphic.LinearGradient(0, 1, 1, 1, [
{ offset: 0, color: 'rgba(255,85,127,1)' },
{ offset: 1, color: 'rgba(255,85,127,1)' },
]),
new echarts.graphic.LinearGradient(0, 1, 1, 1, [
{ offset: 0, color: 'rgba(255,170,0,1)' },
{ offset: 1, color: 'rgba(255,170,0,1)' },
]),
new echarts.graphic.LinearGradient(0, 1, 1, 1, [
{ offset: 0, color: 'rgba(84,112,198,1)' },
{ offset: 1, color: 'rgba(84,112,198,1)' },
]),
new echarts.graphic.LinearGradient(0, 1, 1, 1, [
{ offset: 0, color: 'rgba(30,159,255,.82)' },
{ offset: 1, color: 'rgba(30,159,255,.82)' },
]),
];
var rankings = [];
var stationData = [];
var values = [];
datas.forEach(function (it, index) {
rankings.push(it.ranking);
stationData.push(it.station);
values.push(it.value);
});
console.log(rankings)
console.log(stationData)
console.log(values)
function dataFormat(data) {
var arr = [];
data.forEach(function (item, i) {
let itemStyle = {
color: i > 3 ? attackSourcesColor[3] : attackSourcesColor[i],
};
arr.push({
value: item,
itemStyle: itemStyle,
});
});
return arr;
}
option = {
// backgroundColor: '#000',
tooltip: {
trigger: 'axis',
axisPointer: {
type: 'shadow',
},
},
grid: {
left: '0%',
right: '2%',
bottom: '3%',
top:'2%',
containLabel: true,
},
xAxis: {
type: 'value',
splitLine: {
show: false,
},
axisLabel: {
show: false,
},
axisTick: {
show: false,
},
axisLine: {
show: false,
},
},
yAxis: [
{
type: 'category',
inverse: true,
axisLine: {
show: false,
},
axisTick: {
show: false,
},
data: stationData,
axisLabel: {
margin: 30,
fontSize: 14,
align: 'left',
padding: [3, 0, 0, 0],
color: '#000',
rich: {
nt1: {
color: '#fff',
backgroundColor: attackSourcesColor1[0],
width: 20,
height: 18,
fontSize: 12,
align: 'center',
borderRadius: 50,
lineHeight: '5',
padding: [2, 0, 0, 0],
// padding:[0,0,2,0],
},
nt2: {
color: '#fff',
backgroundColor: attackSourcesColor1[1],
width: 20,
height: 18,
fontSize: 12,
align: 'center',
borderRadius: 50,
padding: [2, 0, 0, 0],
},
nt3: {
color: '#fff',
backgroundColor: attackSourcesColor1[2],
width: 20,
height: 18,
fontSize: 12,
align: 'center',
borderRadius: 50,
padding: [2, 0, 0, 0],
},
nt: {
color: '#fff',
backgroundColor: attackSourcesColor1[3],
width: 20,
height: 18,
fontSize: 12,
align: 'center',
borderRadius: 50,
padding: [2, 0, 0, 0],
},
},
formatter: function (value, index) {
index = contains(stationData, value) + 1;
if (index - 1 < 3) {
return ['{nt' + index + '|' + index + '}'].join('n');
} else {
return ['{nt|' + index + '}'].join('n');
}
},
},
},
{
type: 'category',
inverse: true,
axisTick: 'none',
axisLine: 'none',
show: true,
axisLabel: {
textStyle: {
color: '#666',
fontSize: '12',
},
},
data: dataFormat(values),
},
],
series: [
{
zlevel: 1,
name:'',
type: 'bar',
barWidth: 35,
data: dataFormat(values),
align: 'center',
itemStyle: {
normal: {
barBorderRadius: 10,
},
},
label: { //条状中的样式
show: true,
fontSize: 10,
color: '#fff', //条装中字体颜色
textBorderWidth: 2,
padding: [2, 0, 0, 0],
position: "insideLeft",
formatter: (data) => {
return `{labelName|${data.name}}`;
},
rich: {
labelName: {
color: "#fff",
align: "left",
padding: [2, 0, 0, 0],
}
},
},
},
],
};
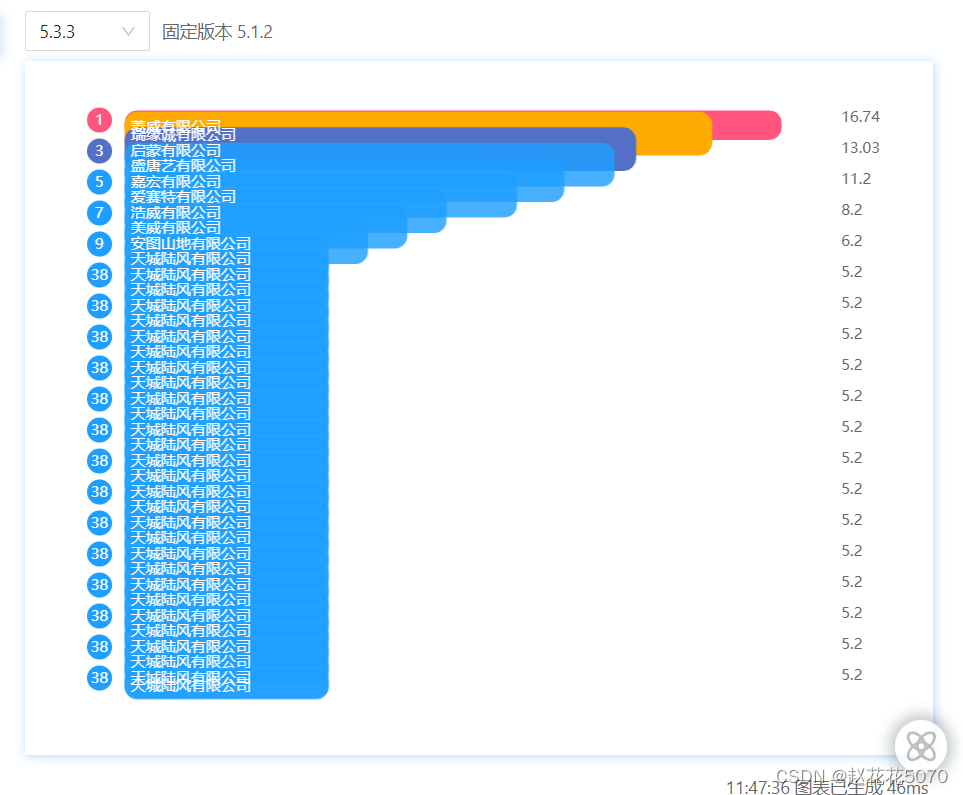
接下来我给大家介绍一个新的配置参数:dataZoom,具体详细配置可以去 echarts官网 查看。
{
	// ...其他配置
	dataZoom: [
	    {
	        type: "slider",
	        realtime: true, // 拖动时,是否实时更新系列的视图
	        startValue: 0,
	        endValue: 5,
	        width: 5,
	        height: "90%",
	        top: "5%",
	        right: 0,
	        // orient: 'vertical', // 设置横向还是纵向, 但是官方不太建议如此使用,建议使用 yAxisIndex 具体指明
	        yAxisIndex: [0, 1], // 控制y轴滚动对象
	        fillerColor: "#0093ff", // 滚动条颜色
	        borderColor: "rgba(17, 100, 210, 0.12)",
	        backgroundColor: "#cfcfcf", //两边未选中的滑动条区域的颜色
	        handleSize: 0, // 两边手柄尺寸
	        showDataShadow: false, //是否显示数据阴影 默认auto
	        showDetail: false, // 拖拽时是否展示滚动条两侧的文字
	        zoomLock: true,
	        moveHandleStyle: {
	            opacity: 0,
	        },
	    },
	    {
	        type: "inside",
	        // width: 0,
	        startValue: 0,
	        endValue: 10,
	        minValueSpan: 10,
	        yAxisIndex: [0],
	        zoomOnMouseWheel: false, // 关闭滚轮缩放
	        moveOnMouseWheel: true, // 开启滚轮平移
	        moveOnMouseMove: true, // 鼠标移动能触发数据窗口平移
	    },
	  ],
	  // 与xAxis,yAxis,series同级
  }
到了这一步,滚动条就实现了,但是到此就真的结束了吗?不一定,因为还是要根据业务来,比如我这里就是只使用滚动,拖拽即可,其他什么过滤,刷新,范围选择这些都不要。
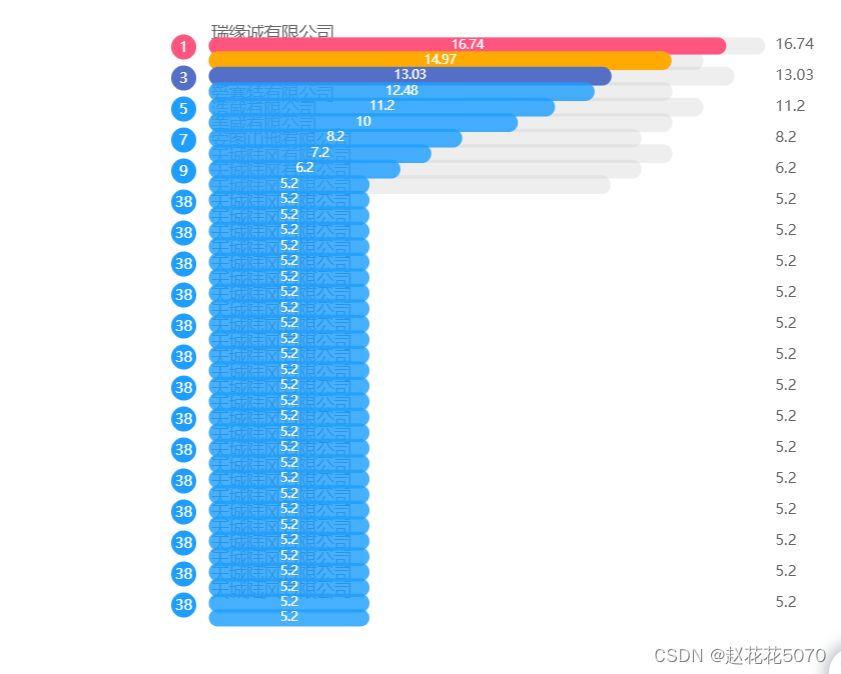
如果大家按照上面的代码练习后,不知道有没有发现一个小问题,就是当鼠标放到滚动条上的时候鼠标箭头会变成一个十字,这就是上面提到的范围筛选的问题。
为什么不想要呢,请看效果:
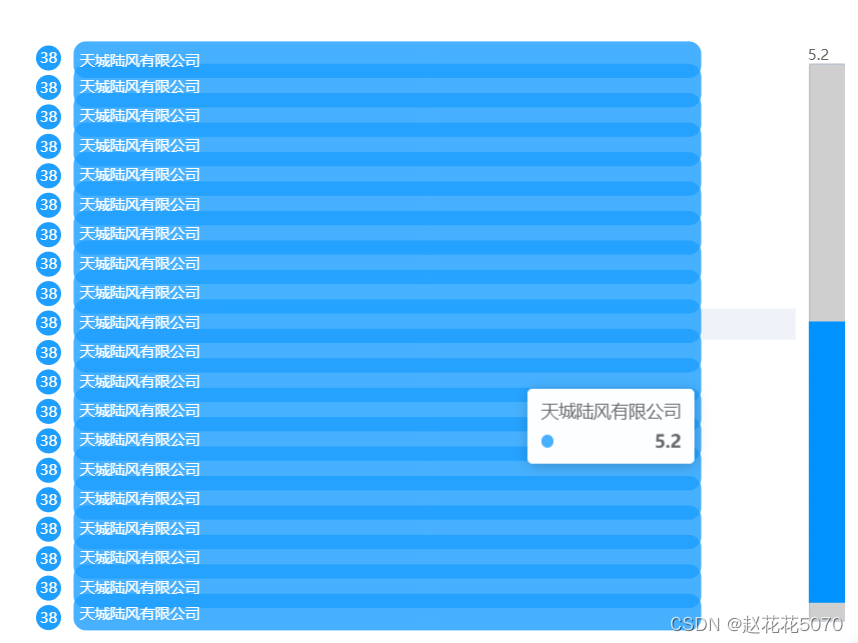
看到没有,密密麻麻的对不,一点也不好看,所以下面贴的代码就是要解决上面这个问题,很简单的一个配置:brushSelect: false
brushSelect 的默认配置为true,此处要改成false。
//参考:https://www.makeapie.com/editor.html?c=xqjNqqjc_U
var datas = [
  { ranking: 1, station: '菱威有限公司', value: 16.74 },
  { ranking: 2, station: '瑞缘诚有限公司', value: 14.97 },
  { ranking: 3, station: '启蒙有限公司', value: 13.03 },
  { ranking: 4, station: '盛唐艺有限公司', value: 12.48 },
  { ranking: 5, station: '嘉宏有限公司', value: 11.20 },
  { ranking: 6, station: '爱赛特有限公司', value: 10.00 },
  { ranking: 7, station: '浩威有限公司', value: 8.20 },
  { ranking: 8, station: '美威有限公司', value: 7.20 },
  { ranking: 9, station: '安图山地有限公司', value: 6.20 },
  { ranking: 10, station: '天城陆风有限公司', value: 5.20 },
  { ranking: 11, station: '天城陆风有限公司', value: 5.20 },
  { ranking: 12, station: '天城陆风有限公司', value: 5.20 },
  { ranking: 13, station: '天城陆风有限公司', value: 5.20 },
  { ranking: 14, station: '天城陆风有限公司', value: 5.20 },
  { ranking: 15, station: '天城陆风有限公司', value: 5.20 },
  { ranking: 16, station: '天城陆风有限公司', value: 5.20 },
  { ranking: 17, station: '天城陆风有限公司', value: 5.20 },
  { ranking: 18, station: '天城陆风有限公司', value: 5.20 },
  { ranking: 19, station: '天城陆风有限公司', value: 5.20 },
  { ranking: 20, station: '天城陆风有限公司', value: 5.20 },
  { ranking: 21, station: '天城陆风有限公司', value: 5.20 },
  { ranking: 22, station: '天城陆风有限公司', value: 5.20 },
  { ranking: 23, station: '天城陆风有限公司', value: 5.20 },
  { ranking: 24, station: '天城陆风有限公司', value: 5.20 },
  { ranking: 25, station: '天城陆风有限公司', value: 5.20 },
  { ranking: 26, station: '天城陆风有限公司', value: 5.20 },
  { ranking: 27, station: '天城陆风有限公司', value: 5.20 },
  { ranking: 28, station: '天城陆风有限公司', value: 5.20 },
  { ranking: 29, station: '天城陆风有限公司', value: 5.20 },
  { ranking: 30, station: '天城陆风有限公司', value: 5.20 },
  { ranking: 31, station: '天城陆风有限公司', value: 5.20 },
  { ranking: 32, station: '天城陆风有限公司', value: 5.20 },
  { ranking: 33, station: '天城陆风有限公司', value: 5.20 },
  { ranking: 34, station: '天城陆风有限公司', value: 5.20 },
  { ranking: 35, station: '天城陆风有限公司', value: 5.20 },
  { ranking: 36, station: '天城陆风有限公司', value: 5.20 },
  { ranking: 37, station: '天城陆风有限公司', value: 5.20 },
  { ranking: 38, station: '天城陆风有限公司', value: 5.20 },
];
var seriesName = ['2023年出口额','2022年出口额'];
var attackSourcesColor1 = ['#FF557F','#FFAA00','#5470C6','#1E9FFF'];
function contains(arr, dst) {
  var i = arr.length;
  while ((i -= 1)) {
    if (arr[i] == dst) {
      return i;
    }
  }
  return false;
}
var attackSourcesColor = [
  new echarts.graphic.LinearGradient(0, 1, 1, 1, [
    { offset: 0, color: 'rgba(255,85,127,1)' },
    { offset: 1, color: 'rgba(255,85,127,1)' },
  ]),
  new echarts.graphic.LinearGradient(0, 1, 1, 1, [
    { offset: 0, color: 'rgba(255,170,0,1)' },
    { offset: 1, color: 'rgba(255,170,0,1)' },
  ]),
  new echarts.graphic.LinearGradient(0, 1, 1, 1, [
    { offset: 0, color: 'rgba(84,112,198,1)' },
    { offset: 1, color: 'rgba(84,112,198,1)' },
  ]),
  new echarts.graphic.LinearGradient(0, 1, 1, 1, [
    { offset: 0, color: 'rgba(30,159,255,.82)' },
    { offset: 1, color: 'rgba(30,159,255,.82)' },
  ]),
];

var rankings = [];
var stationData = [];
var values = [];

datas.forEach(function (it, index) {
  rankings.push(it.ranking);
  stationData.push(it.station);
  values.push(it.value);
});

console.log(rankings)
console.log(stationData)
console.log(values)

function dataFormat(data) {
  var arr = [];
  data.forEach(function (item, i) {
    let itemStyle = {
      color: i > 3 ? attackSourcesColor[3] : attackSourcesColor[i],
    };
    arr.push({
      value: item,
      itemStyle: itemStyle,
    });
  });
  return arr;
}

option = {
  // backgroundColor: '#000',
  tooltip: {
    trigger: 'axis',
    axisPointer: {
      type: 'shadow',
    },
  },

  grid: {
    left: '0%',
    right: '2%',
    bottom: '3%',
    top:'2%',
    containLabel: true,
  },
  xAxis: {
    type: 'value',
    splitLine: {
      show: false,
    },
    axisLabel: {
      show: false,
    },
    axisTick: {
      show: false,
    },
    axisLine: {
      show: false,
    },
  },
  yAxis: [
    {
      type: 'category',
      inverse: true,
      axisLine: {
        show: false,
      },
      axisTick: {
        show: false,
      },
      data: stationData,
      axisLabel: {
        margin: 30,
        fontSize: 14,
        align: 'left',
        padding: [3, 0, 0, 0],
        color: '#000',
        rich: {
          nt1: {
            color: '#fff',
            backgroundColor: attackSourcesColor1[0],
            width: 20,
            height: 18,
            fontSize: 12,
            align: 'center',
            borderRadius: 50,
            lineHeight: '5',
            padding: [2, 0, 0, 0],
            // padding:[0,0,2,0],
          },
          nt2: {
            color: '#fff',
            backgroundColor: attackSourcesColor1[1],
            width: 20,
            height: 18,
            fontSize: 12,
            align: 'center',
            borderRadius: 50,
            padding: [2, 0, 0, 0],
          },
          nt3: {
            color: '#fff',
            backgroundColor: attackSourcesColor1[2],
            width: 20,
            height: 18,
            fontSize: 12,
            align: 'center',
            borderRadius: 50,
            padding: [2, 0, 0, 0],
          },
          nt: {
            color: '#fff',
            backgroundColor: attackSourcesColor1[3],
            width: 20,
            height: 18,
            fontSize: 12,
            align: 'center',
            borderRadius: 50,
            padding: [2, 0, 0, 0],
          },
        },
        formatter: function (value, index) {
          index = contains(stationData, value) + 1;
          if (index - 1 < 3) {
            return ['{nt' + index + '|' + index + '}'].join('n');
          } else {
            return ['{nt|' + index + '}'].join('n');
          }
        },
      },
    },

    {
      type: 'category',
      inverse: true,
      axisTick: 'none',
      axisLine: 'none',
      show: true,
      axisLabel: {
        textStyle: {
          color: '#666',
          fontSize: '12',
        },
      },
      data: dataFormat(values),
    },

  ],
  dataZoom: [
    {
        type: "slider",
        realtime: true, // 拖动时,是否实时更新系列的视图
        startValue: 0,
        endValue: 5,
        width: 5,
        height: "90%",
        top: "5%",
        right: 0,
        brushSelect: false,
        yAxisIndex: [0, 1], // 控制y轴滚动
        fillerColor: "#0093ff", // 滚动条颜色
        borderColor: "rgba(17, 100, 210, 0.12)",
        backgroundColor: "#cfcfcf", //两边未选中的滑动条区域的颜色
        handleSize: 0, // 两边手柄尺寸
        showDataShadow: false, //是否显示数据阴影 默认auto
        showDetail: false, // 拖拽时是否展示滚动条两侧的文字
        zoomLock: true,
        moveHandleStyle: {
            opacity: 0,
        },
    },
    {
        type: "inside",
        // width: 0,
        startValue: 0,
        endValue: 10,
        minValueSpan: 10,
        //   maxValueSpan: 20,
        yAxisIndex: [0],
        zoomOnMouseWheel: false, // 关闭滚轮缩放
        moveOnMouseWheel: true, // 开启滚轮平移
        moveOnMouseMove: true, // 鼠标移动能触发数据窗口平移
    },
  ],
  series: [
    {
      zlevel: 1,
      name:'',
      type: 'bar',
      barWidth: 35,
      data: dataFormat(values),
      align: 'center',
      itemStyle: {
        normal: {
          barBorderRadius: 10,
        },
      },
      label: {   //条状中的样式
        show: true,
        fontSize: 10,
        color: '#fff', //条装中字体颜色
        textBorderWidth: 2,
        padding: [2, 0, 0, 0],
        position: "insideLeft",
        formatter: (data) => {
          return `{labelName|${data.name}}`;
        },
        rich: {
          labelName: {
              color: "#fff",
              align: "left",
              padding: [2, 0, 0, 0],
          }
        },
      },
    },
  ],
};
原文地址:https://blog.csdn.net/weixin_42728767/article/details/131303246
本文来自互联网用户投稿,该文观点仅代表作者本人,不代表本站立场。本站仅提供信息存储空间服务,不拥有所有权,不承担相关法律责任。
如若转载,请注明出处:http://www.7code.cn/show_14937.html
如若内容造成侵权/违法违规/事实不符,请联系代码007邮箱:suwngjj01@126.com进行投诉反馈,一经查实,立即删除!