安装echarts
通过npm install echarts —save安装echarts组件。
全局使用echarts
在src目录下创建components/echarts/index.js文件(名字随便起),按需引入组件。
// 引入 echarts 核心模块,核心模块提供了 echarts 使用必须要的接口。
import * as echarts from "echarts/core";

/** 引入任意图表,这里引入的是柱状图and折线图图表(图表后缀都为 Chart)  */
import { BarChart, LineChart } from "echarts/charts";

// 引入提示框,标题,直角坐标系,数据集,内置数据转换器组件,组件后缀都为 Component
import {
  TitleComponent,
  TooltipComponent,
  GridComponent,
  DatasetComponent,
  TransformComponent,
} from "echarts/components";

// 标签自动布局,全局过渡动画等特性
import { LabelLayout, UniversalTransition } from "echarts/features";

// 引入 Canvas 渲染器,注意引入 CanvasRenderer 或者 SVGRenderer 是必须的一步
import { CanvasRenderer } from "echarts/renderers";

// 注册必须的组件
echarts.use([
  TitleComponent,
  TooltipComponent,
  GridComponent,
  DatasetComponent,
  TransformComponent,
  BarChart,
  LabelLayout,
  UniversalTransition,
  CanvasRenderer,
  LineChart,
]);

// 导出
export default echarts;import echarts from "echarts"; // npm install echarts --save
Vue.prototype.$echarts = echarts;
调用的时候用this.$echarts就可以了<template>
<div>
<div id="maychar"></div>
</div>
</template>
<script>
export default {
data() {
return {};
},
mounted() {
this.getCharts();
},
methods: {
// 使用柱形图,关于其他配置可以去官网查看
getCharts() {
const chartBox = this.$echarts.init(document.getElementById("maychar"));
const option = {
xAxis: {
data: ["Mon", "Tue", "Wed", "Thu", "Fri", "Sat", "Sun"],
},
yAxis: {},
series: [
{
type: "bar",
data: [23, 24, 18, 25, 27, 28, 25],
},
],
};
chartBox.setOption(option);
// 根据页面大小自动响应图表大小
window.addEventListener("resize", function () {
chartBox.resize();
});
},
},
};
</script>组件使用echarts
在src目录下创建components/xxx文件(自己起名字),在script中引入核心模块,由于异步问题,可能会获取不到父组件传递过来的数据,我们可以利用watch监听来解决。
下面以树图为例子:(很长因为有很多配置属性,实际开发不用全部添加)
<template>
    <div class="echarts-container"></div>
</template>

<script>
import * as echarts from "echarts/core";
import { TooltipComponent } from "echarts/components";
import { TreeChart } from "echarts/charts";
import { CanvasRenderer } from "echarts/renderers";
import { LegendComponent } from "echarts/components";

echarts.use([TooltipComponent, TreeChart, CanvasRenderer, LegendComponent]);
var myChart;
var option;
export default {
    name: "TreeChart",
    props: {
        treeData: {
            // 树图数据
            type: Object,
            default: () => {
                return {};
            },
        },
    },
    mounted() {
        this.init();
        // 监听树图节点的点击事件
        myChart.on("click", (e) => {
            // console.log("e:", this.treeData);
            this.$emit("clickNode", e.data);
        });
    },
    watch: {
        treeData(n, o) {
            // console.log("tree改变", n, o);
            this.init();
        },
    },
    methods: {
        init() {
            // console.log('$el:', this.$el)
            myChart = echarts.init(this.$el);
            option = {
                tooltip: {
                    // 提示框浮层设置
                    trigger: "item",
                    triggerOn: "mousemove", // 提示框触发条件
                    enterable: true, // 鼠标是否可进入提示框浮层中,默认false
                    confine: true, // 是否将tooltip框限制在图表的区域内
                    formatter: function (params) {
                        // 提示框浮层内容格式器,支持字符串模板和回调函数两种形式
                        // console.log("params:", params);
                        return (
                            // params.marker +
                            params.name
                            // + "<br/>" +
                            // "$ " +
                            // (params.value || "--")
                        );
                    },
                    // valueFormatter: function (value) { // tooltip 中数值显示部分的格式化回调函数
                    //   return '$' + value.toFixed(2)
                    // },
                    backgroundColor: "#FFF", // 提示框浮层的背景颜色
                    borderColor: "rgba(0, 0, 0, .2)", // 提示框浮层的边框颜色
                    borderWidth: 1, // 提示框浮层的边框宽
                    borderRadius: 4, // 提示框浮层圆角
                    padding: [4, 8], // 提示框浮层的内边距
                    textStyle: {
                        // 提示框浮层的文本样式
                        color: "#333", // 文字颜色
                        fontWeight: 400, // 字体粗细
                        fontSize: 14, // 字体大小
                        lineHeight: 20, // 行高
                        width: 60, // 文本显示宽度
                        // 文字超出宽度是否截断或者换行;只有配置width时有效
                        overflow: "breakAll", // truncate截断,并在末尾显示ellipsis配置的文本,默认为...;break换行;breakAll换行,并强制单词内换行
                        ellipsis: "...",
                    },
                    extraCssText:
                        "box-shadow: 0 0 9px rgba(0, 0, 0, 0.3);text-align: right;", // 额外添加到浮层的css样式
                },
                legend: {
                    type: "scroll",
                    orient: "vertical",
                    right: 10,
                    top: 20,
                    bottom: 20,
                    data: this.treeData,
                },
                series: [
                    {
                        type: "tree",
                        data: [this.treeData],
                        name: "树图",
                        top: "1%", // 组件离容器上侧的距离,像素值20,或相对容器的百分比20%
                        left: "7%", // 组件离容器左侧的距离
                        bottom: "1%", // 组件离容器下侧的距离
                        right: "20%", // 组件离容器右侧的距离
                        layout: "orthogonal", // 树图的布局,正交orthogonal和径向radial两种
                        orient: "RL", // 树图中正交布局的方向,'LR','RL','TB','BT',只有布局是正交时才生效
                        edgeShape: "curve", // 树图边的形状,有曲线curve和折线polyline两种,只有正交布局下生效                 待定
                        roam: false, // 是否开启鼠标缩放或平移,默认false
                        initialTreeDepth: 5, // 树图初始的展开层级(深度),根节点是0,不设置时全部展开
                        // symbol: 'arrow', // 标记的图形,默认是emptyCircle;circle,rect,roundRect,triangle,diamond,pin,arrow,none
                        // symbolRotate: 270, // 配合symbol:arrow图形使用效果较好
                        symbolSize: 7, // 大于0时是圆圈,等于0时不展示,标记的大小
                        itemStyle: {
                            // 树图中每个节点的样式                                                                         待定
                            color: "#91cc75", // 节点未展开时的填充色
                            borderColor: "rgba(255, 144, 0, 1)", // 图形的描边颜色
                            borderWidth: 1, // 描边线宽,为0时无描边
                            borderType: "solid", // 描边类型
                            borderCap: "square", // 指定线段末端的绘制方式butt方形结束,round圆形结束,square
                            shadowColor: "rgba(0,121,221,0.3)", // 阴影颜色
                            shadowBlur: 16, // 图形阴影的模糊大小
                            opacity: 1, // 图形透明度
                        },
                        label: {
                            // 每个节点对应的文本标签样式
                            show: true, // 是否显示标签
                            // distance: 8, // 文本距离图形元素的距离
                            position: "left", // 标签位置
                            verticalAlign: "middle", // 文字垂直对齐方式,默认自动,top,middle,bottom
                            align: "right", // 文字水平对齐方式,默认自动,left,right,center
                            fontSize: 14, // 字体大小
                            color: "#333", // 字体颜色
                            // backgroundColor: "rgb(230, 250, 208)", // 文字块的背景颜色
                            // borderColor: "#1890FF", // 文字块边框颜色
                            // borderWidth: 1, // 文字块边框宽度
                            // borderType: "solid", // 文字块边框描边类型 solid dashed dotted
                            // borderRadius: 4, // 文字块的圆角
                            // padding: [6, 12], // 文字块内边距
                            // shadowColor: "rgba(0,121,221,0.3)", // 文字块的背景阴影颜色
                            // shadowBlur: 6, // 文字块的背景阴影长度
                            width: 60,
                            // 文字超出宽度是否截断或者换行;只有配置width时有效
                            overflow: "backAll", // truncate截断,并在末尾显示ellipsis配置的文本,默认为...;break换行;breakAll换行,并强制单词内换行
                            ellipsis: "...",
                        },
                        lineStyle: {
                            // 树图边的样式
                            color: "#ccc", // 树图边的颜色
                            width: 1.5, // 树图边的宽度
                            curveness: 0.5, // 树图边的曲度
                            // shadowColor: "rgba(0, 0, 0, 0.5)", // 阴影颜色
                            // shadowBlur: 10, // 图形阴影的模糊大小
                        },
                        emphasis: {
                            // 树图中图形和标签高亮的样式
                            disabled: false, // 是否关闭高亮状态,默认false
                            // 在高亮图形时,是否淡出其它数据的图形已达到聚焦的效果
                            focus: "none", // none不淡出其他图形(默认);self只聚焦当前高亮的数据图形;series聚焦当前高亮的数据所在系列的所有图形;ancestor聚焦所有祖先节点;descendant聚焦所有子孙节点;relative聚焦所有子孙和祖先节点
                            blurScope: "coordinateSystem", // 开启focus时,配置淡出的范围,coordinateSystem淡出范围为坐标系(默认);series淡出范围为系列;global淡出范围为全局
                            itemStyle: {
                                // 该节点的样式
                                // color: "#1890FF", // 图形的颜色
                                borderColor: "rgb(145,204,117)", // 图形的描边颜色
                                borderWidth: 1, // 描边线宽,为0时无描边
                                borderType: "solid", // 描边类型 solid dashed dotted
                                borderCap: "square", // 指定线段末端的绘制方式butt方形结束,round圆形结束,square
                                shadowColor: "rgba(0,121,221,0.3)", // 阴影颜色
                                shadowBlur: 12, // 图形阴影的模糊大小
                                opacity: 1, // 图形透明度
                            },
                            lineStyle: {
                                // 树图边的样式
                                color: "rgba(0,0,0,.45)", // 树图边的颜色
                                width: 1.5, // 树图边的宽度
                                curveness: 0.5, // 树图边的曲度
                                // shadowColor: "rgba(0, 0, 0, 0.5)", // 阴影颜色
                                // shadowBlur: 6, // 图形阴影的模糊大小
                            },
                            label: {
                                // 高亮标签的文本样式
                                color: "#333",
                                fontWeight: 600,
                            },
                        },
                        blur: {
                            // 淡出状态的相关配置,开启emphasis.focus后有效
                            itemStyle: {}, // 节点的样式
                            lineStyle: {}, // 树图边的样式
                            label: {}, // 淡出标签的文本样式
                        },
                        leaves: {
                            // 叶子节点的特殊配置
                            label: {
                                // 叶子节点的文本标签样式
                                // distance: 8,
                                // color: '#1890FF',
                                position: "right",
                                verticalAlign: "middle",
                                align: "left",
                            },
                            itemStyle: {}, // 叶子节点的样式
                            emphasis: {}, // 叶子节点高亮状态的配置
                            blur: {}, // 叶子节点淡出状态的配置
                            select: {}, // 叶子节点选中状态的配置
                        },
                        animation: true, // 是否开启动画
                        expandAndCollapse: true, // 子树折叠和展开的交互,默认打开
                        animationDuration: 300, // 初始动画的时长
                        animationEasing: "linear", // 初始动画的缓动效果
                        animationDelay: 0, // 初始动画的延迟
                        animationDurationUpdate: 400, // 数据更新动画的时长
                        animationEasingUpdate: "cubicInOut", // 数据更新动画的缓动效果
                        animationDelayUpdate: 0, // 数据更新动画的延迟
                    },
                ],
            };
            myChart.setOption(option);
        },
    },
};
</script>
<style scoped>
.echarts-container {
    width: 800px;
    height: 350px;
}
</style>在使用组件的vue文件下添加以下代码:(以大熊猫项目为例子,遍历族谱图)
<template>
    <div class="backg" align="center">
        <div class="bor">
            <div class="innerBackg" v-loading="loading">
                <div v-for="item in treeData" :key="item.name">
                    <TreeChart
                        :treeData="item"
                        @clickNode="getNodeData"
                        v-if="item.children"
                    />
                </div>
            </div>
        </div>
    </div>
</template>

<script>
import TreeChart from "@/components/TreeChart";
import pandaApi from "@/api/Rbac/Panda";

export default {
    components: {
        TreeChart,
    },
    data() {
        return {
            loading: true, // 是否加载完毕
            treeData: {},
        };
    },
    created() {
        this.getFamily();
    },
    methods: {
        getNodeData(data) {
            console.log("data:", data);
        },
        getFamily() {
            pandaApi
                .getFamily()
                .then((res) => {
                    // 将parent属性更改为children
                    let arr = JSON.parse(
                        JSON.stringify(res.data).replaceAll(
                            /parent/g,
                            "children"
                        )
                    );

                    this.treeData = arr;
                    this.loading = false;
                })
                .catch((err) => {
                    this.$message.error("获取失败", err);
                });
        },
    },
};
</script>

<style scoped>
.backg {
    /* 实现滚动条 */
    overflow-y: scroll;
    background-color: rgb(230, 250, 208);
    width: 100%;
    min-height: 90vh;
    height: 0;
    padding-top: 20px;
}
.bor {
    width: 96%;
    min-height: 83vh;
    height: auto;
    background-color: white;
    border: 1px solid rgb(187, 187, 187);
    padding-top: 20px;
}
.innerBackg {
    width: 95%;
    min-height: 80vh;
    height: auto;
    background-color: rgb(243, 243, 243);
}
</style>
关于按需引入
不同版本区别:(参考五分钟上手Echarts-官方文档_echarts官网_寒泉Hq的博客-CSDN博客)
完全版:echarts/dist/echarts.js,体积最大,包含所有的图表和组件,所包含内容参见:echarts/echarts.all.js。
常用版:echarts/dist/echarts.common.js,体积适中,包含常见的图表和组件,所包含内容参见:echarts/echarts.common.js。
精简版:echarts/dist/echarts.simple.js,体积较小,仅包含最常用的图表和组件,所包含内容参见:echarts/echarts.simple.js。
想好需要引入的图表,在官网查到对应名字,比如柱形图和折线图,那就需要引入BarCharts与LineCharts组件,即:(有时候电脑打不开,这里就用手机版的网页截图进行展示了)
import {LineChart, BarChart} from "echarts/charts"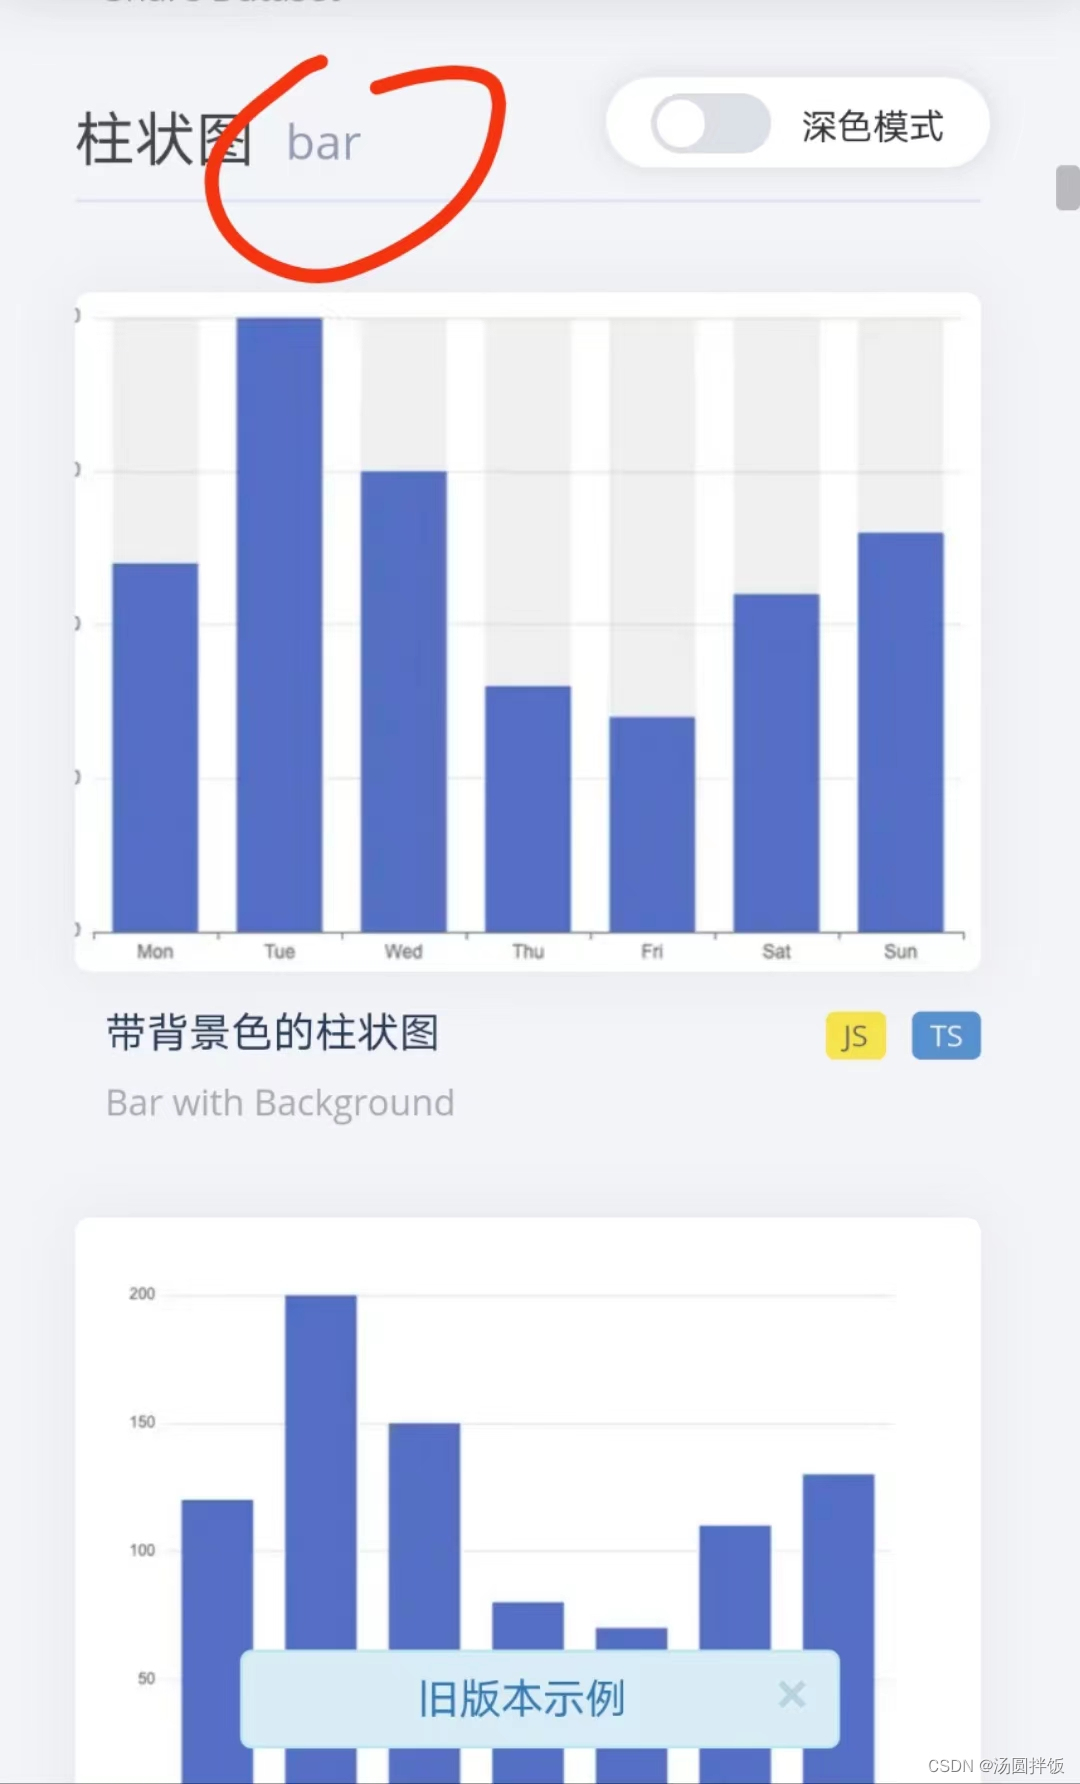

也就是说,需要引入什么图表,就找到官网中对应的名字+Chart就可以了(首字母都要大写)。
关于echarts各项属性配置
https://blog.csdn.net/mrsun_web/article/details/121074265
官网链接:http://echarts.baidu.com/echarts2/doc/example/themeDesigner.html
https://www.echartsjs.com/tutorial.html#5%20%E5%88%86%E9%92%9F%E4%B8%8A%E6%89%8B%20ECharts
theme = {
// 全图默认背景
// backgroundColor: 'rgba(0,0,0,0)',
// 默认色板
color: ['#ff7f50','#87cefa','#da70d6','#32cd32','#6495ed',
'#ff69b4','#ba55d3','#cd5c5c','#ffa500','#40e0d0',
'#1e90ff','#ff6347','#7b68ee','#00fa9a','#ffd700',
'#6699FF','#ff6666','#3cb371','#b8860b','#30e0e0'],
// 图表标题
title: {
x: 'left', // 水平安放位置,默认为左对齐,可选为:
// 'center' ¦ 'left' ¦ 'right'
// ¦ {number}(x坐标,单位px)
y: 'top', // 垂直安放位置,默认为全图顶端,可选为:
// 'top' ¦ 'bottom' ¦ 'center'
// ¦ {number}(y坐标,单位px)
//textAlign: null // 水平对齐方式,默认根据x设置自动调整
backgroundColor: 'rgba(0,0,0,0)',
borderColor: '#ccc', // 标题边框颜色
borderWidth: 0, // 标题边框线宽,单位px,默认为0(无边框)
padding: 5, // 标题内边距,单位px,默认各方向内边距为5,
// 接受数组分别设定上右下左边距,同css
itemGap: 10, // 主副标题纵向间隔,单位px,默认为10,
textStyle: {
fontSize: 18,
fontWeight: 'bolder',
color: '#333' // 主标题文字颜色
},
subtextStyle: {
color: '#aaa' // 副标题文字颜色
}
},
// 图例
legend: {
orient: 'horizontal', // 布局方式,默认为水平布局,可选为:
// 'horizontal' ¦ 'vertical'
x: 'center', // 水平安放位置,默认为全图居中,可选为:
// 'center' ¦ 'left' ¦ 'right'
// ¦ {number}(x坐标,单位px)
y: 'top', // 垂直安放位置,默认为全图顶端,可选为:
// 'top' ¦ 'bottom' ¦ 'center'
// ¦ {number}(y坐标,单位px)
backgroundColor: 'rgba(0,0,0,0)',
borderColor: '#ccc', // 图例边框颜色
borderWidth: 0, // 图例边框线宽,单位px,默认为0(无边框)
padding: 5, // 图例内边距,单位px,默认各方向内边距为5,
// 接受数组分别设定上右下左边距,同css
itemGap: 10, // 各个item之间的间隔,单位px,默认为10,
// 横向布局时为水平间隔,纵向布局时为纵向间隔
itemWidth: 20, // 图例图形宽度
itemHeight: 14, // 图例图形高度
textStyle: {
color: '#333' // 图例文字颜色
}
},
// 值域
dataRange: {
orient: 'vertical', // 布局方式,默认为垂直布局,可选为:
// 'horizontal' ¦ 'vertical'
x: 'left', // 水平安放位置,默认为全图左对齐,可选为:
// 'center' ¦ 'left' ¦ 'right'
// ¦ {number}(x坐标,单位px)
y: 'bottom', // 垂直安放位置,默认为全图底部,可选为:
// 'top' ¦ 'bottom' ¦ 'center'
// ¦ {number}(y坐标,单位px)
backgroundColor: 'rgba(0,0,0,0)',
borderColor: '#ccc', // 值域边框颜色
borderWidth: 0, // 值域边框线宽,单位px,默认为0(无边框)
padding: 5, // 值域内边距,单位px,默认各方向内边距为5,
// 接受数组分别设定上右下左边距,同css
itemGap: 10, // 各个item之间的间隔,单位px,默认为10,
// 横向布局时为水平间隔,纵向布局时为纵向间隔
itemWidth: 20, // 值域图形宽度,线性渐变水平布局宽度为该值 * 10
itemHeight: 14, // 值域图形高度,线性渐变垂直布局高度为该值 * 10
splitNumber: 5, // 分割段数,默认为5,为0时为线性渐变
color:['#1e90ff','#f0ffff'],//颜色
//text:['高','低'], // 文本,默认为数值文本
textStyle: {
color: '#333' // 值域文字颜色
}
},
toolbox: {
orient: 'horizontal', // 布局方式,默认为水平布局,可选为:
// 'horizontal' ¦ 'vertical'
x: 'right', // 水平安放位置,默认为全图右对齐,可选为:
// 'center' ¦ 'left' ¦ 'right'
// ¦ {number}(x坐标,单位px)
y: 'top', // 垂直安放位置,默认为全图顶端,可选为:
// 'top' ¦ 'bottom' ¦ 'center'
// ¦ {number}(y坐标,单位px)
color : ['#1e90ff','#22bb22','#4b0082','#d2691e'],
backgroundColor: 'rgba(0,0,0,0)', // 工具箱背景颜色
borderColor: '#ccc', // 工具箱边框颜色
borderWidth: 0, // 工具箱边框线宽,单位px,默认为0(无边框)
padding: 5, // 工具箱内边距,单位px,默认各方向内边距为5,
// 接受数组分别设定上右下左边距,同css
itemGap: 10, // 各个item之间的间隔,单位px,默认为10,
// 横向布局时为水平间隔,纵向布局时为纵向间隔
itemSize: 16, // 工具箱图形宽度
featureImageIcon : {}, // 自定义图片icon
featureTitle : {
mark : '辅助线开关',
markUndo : '删除辅助线',
markClear : '清空辅助线',
dataZoom : '区域缩放',
dataZoomReset : '区域缩放后退',
dataView : '数据视图',
lineChart : '折线图切换',
barChart : '柱形图切换',
restore : '还原',
saveAsImage : '保存为图片'
}
},
// 提示框
tooltip: {
trigger: 'item', // 触发类型,默认数据触发,见下图,可选为:'item' ¦ 'axis'
showDelay: 20, // 显示延迟,添加显示延迟可以避免频繁切换,单位ms
hideDelay: 100, // 隐藏延迟,单位ms
transitionDuration : 0.4, // 动画变换时间,单位s
backgroundColor: 'rgba(0,0,0,0.7)', // 提示背景颜色,默认为透明度为0.7的黑色
borderColor: '#333', // 提示边框颜色
borderRadius: 4, // 提示边框圆角,单位px,默认为4
borderWidth: 0, // 提示边框线宽,单位px,默认为0(无边框)
padding: 5, // 提示内边距,单位px,默认各方向内边距为5,
// 接受数组分别设定上右下左边距,同css
axisPointer : { // 坐标轴指示器,坐标轴触发有效
type : 'line', // 默认为直线,可选为:'line' | 'shadow'
lineStyle : { // 直线指示器样式设置
color: '#48b',
width: 2,
type: 'solid'
},
shadowStyle : { // 阴影指示器样式设置
width: 'auto', // 阴影大小
color: 'rgba(150,150,150,0.3)' // 阴影颜色
}
},
textStyle: {
color: '#fff'
}
},
// 区域缩放控制器
dataZoom: {
orient: 'horizontal', // 布局方式,默认为水平布局,可选为:
// 'horizontal' ¦ 'vertical'
// x: {number}, // 水平安放位置,默认为根据grid参数适配,可选为:
// {number}(x坐标,单位px)
// y: {number}, // 垂直安放位置,默认为根据grid参数适配,可选为:
// {number}(y坐标,单位px)
// width: {number}, // 指定宽度,横向布局时默认为根据grid参数适配
// height: {number}, // 指定高度,纵向布局时默认为根据grid参数适配
backgroundColor: 'rgba(0,0,0,0)', // 背景颜色
dataBackgroundColor: '#eee', // 数据背景颜色
fillerColor: 'rgba(144,197,237,0.2)', // 填充颜色
handleColor: 'rgba(70,130,180,0.8)' // 手柄颜色
},
// 网格
grid: {
x: 80,
y: 60,
x2: 80,
y2: 60,
// width: {totalWidth} - x - x2,
// height: {totalHeight} - y - y2,
backgroundColor: 'rgba(0,0,0,0)',
borderWidth: 1,
borderColor: '#ccc'
},
// 类目轴
categoryAxis: {
position: 'bottom', // 位置
nameLocation: 'end', // 坐标轴名字位置,支持'start' | 'end'
boundaryGap: true, // 类目起始和结束两端空白策略
axisLine: { // 坐标轴线
show: true, // 默认显示,属性show控制显示与否
lineStyle: { // 属性lineStyle控制线条样式
color: '#48b',
width: 2,
type: 'solid'
}
},
axisTick: { // 坐标轴小标记
show: true, // 属性show控制显示与否,默认不显示
interval: 'auto',
// onGap: null,
inside : false, // 控制小标记是否在grid里
length :5, // 属性length控制线长
lineStyle: { // 属性lineStyle控制线条样式
color: '#333',
width: 1
}
},
axisLabel: { // 坐标轴文本标签,详见axis.axisLabel
show: true,
interval: 'auto',
rotate: 0,
margin: 8,
// formatter: null,
textStyle: { // 其余属性默认使用全局文本样式,详见TEXTSTYLE
color: '#333'
}
},
splitLine: { // 分隔线
show: true, // 默认显示,属性show控制显示与否
// onGap: null,
lineStyle: { // 属性lineStyle(详见lineStyle)控制线条样式
color: ['#ccc'],
width: 1,
type: 'solid'
}
},
splitArea: { // 分隔区域
show: false, // 默认不显示,属性show控制显示与否
// onGap: null,
areaStyle: { // 属性areaStyle(详见areaStyle)控制区域样式
color: ['rgba(250,250,250,0.3)','rgba(200,200,200,0.3)']
}
}
},
// 数值型坐标轴默认参数
valueAxis: {
position: 'left', // 位置
nameLocation: 'end', // 坐标轴名字位置,支持'start' | 'end'
nameTextStyle: {}, // 坐标轴文字样式,默认取全局样式
boundaryGap: [0, 0], // 数值起始和结束两端空白策略
splitNumber: 5, // 分割段数,默认为5
axisLine: { // 坐标轴线
show: true, // 默认显示,属性show控制显示与否
lineStyle: { // 属性lineStyle控制线条样式
color: '#48b',
width: 2,
type: 'solid'
}
},
axisTick: { // 坐标轴小标记
show: false, // 属性show控制显示与否,默认不显示
inside : false, // 控制小标记是否在grid里
length :5, // 属性length控制线长
lineStyle: { // 属性lineStyle控制线条样式
color: '#333',
width: 1
}
},
axisLabel: { // 坐标轴文本标签,详见axis.axisLabel
show: true,
rotate: 0,
margin: 8,
// formatter: null,
textStyle: { // 其余属性默认使用全局文本样式,详见TEXTSTYLE
color: '#333'
}
},
splitLine: { // 分隔线
show: true, // 默认显示,属性show控制显示与否
lineStyle: { // 属性lineStyle(详见lineStyle)控制线条样式
color: ['#ccc'],
width: 1,
type: 'solid'
}
},
splitArea: { // 分隔区域
show: false, // 默认不显示,属性show控制显示与否
areaStyle: { // 属性areaStyle(详见areaStyle)控制区域样式
color: ['rgba(250,250,250,0.3)','rgba(200,200,200,0.3)']
}
}
},
polar : {
center : ['50%', '50%'], // 默认全局居中
radius : '75%',
startAngle : 90,
splitNumber : 5,
name : {
show: true,
textStyle: { // 其余属性默认使用全局文本样式,详见TEXTSTYLE
color: '#333'
}
},
axisLine: { // 坐标轴线
show: true, // 默认显示,属性show控制显示与否
lineStyle: { // 属性lineStyle控制线条样式
color: '#ccc',
width: 1,
type: 'solid'
}
},
axisLabel: { // 坐标轴文本标签,详见axis.axisLabel
show: false,
textStyle: { // 其余属性默认使用全局文本样式,详见TEXTSTYLE
color: '#333'
}
},
splitArea : {
show : true,
areaStyle : {
color: ['rgba(250,250,250,0.3)','rgba(200,200,200,0.3)']
}
},
splitLine : {
show : true,
lineStyle : {
width : 1,
color : '#ccc'
}
}
},
// 柱形图默认参数
bar: {
barMinHeight: 0, // 最小高度改为0
// barWidth: null, // 默认自适应
barGap: '30%', // 柱间距离,默认为柱形宽度的30%,可设固定值
barCategoryGap : '20%', // 类目间柱形距离,默认为类目间距的20%,可设固定值
itemStyle: {
normal: {
// color: '各异',
barBorderColor: '#fff', // 柱条边线
barBorderRadius: 0, // 柱条边线圆角,单位px,默认为0
barBorderWidth: 1, // 柱条边线线宽,单位px,默认为1
label: {
show: false
// position: 默认自适应,水平布局为'top',垂直布局为'right',可选为
// 'inside'|'left'|'right'|'top'|'bottom'
// textStyle: null // 默认使用全局文本样式,详见TEXTSTYLE
}
},
emphasis: {
// color: '各异',
barBorderColor: 'rgba(0,0,0,0)', // 柱条边线
barBorderRadius: 0, // 柱条边线圆角,单位px,默认为0
barBorderWidth: 1, // 柱条边线线宽,单位px,默认为1
label: {
show: false
// position: 默认自适应,水平布局为'top',垂直布局为'right',可选为
// 'inside'|'left'|'right'|'top'|'bottom'
// textStyle: null // 默认使用全局文本样式,详见TEXTSTYLE
}
}
}
},
// 折线图默认参数
line: {
itemStyle: {
normal: {
// color: 各异,
label: {
show: false
// position: 默认自适应,水平布局为'top',垂直布局为'right',可选为
// 'inside'|'left'|'right'|'top'|'bottom'
// textStyle: null // 默认使用全局文本样式,详见TEXTSTYLE
},
lineStyle: {
width: 2,
type: 'solid',
shadowColor : 'rgba(0,0,0,0)', //默认透明
shadowBlur: 5,
shadowOffsetX: 3,
shadowOffsetY: 3
}
},
emphasis: {
// color: 各异,
label: {
show: false
// position: 默认自适应,水平布局为'top',垂直布局为'right',可选为
// 'inside'|'left'|'right'|'top'|'bottom'
// textStyle: null // 默认使用全局文本样式,详见TEXTSTYLE
}
}
},
//smooth : false,
//symbol: null, // 拐点图形类型
symbolSize: 2, // 拐点图形大小
//symbolRotate : null, // 拐点图形旋转控制
showAllSymbol: false // 标志图形默认只有主轴显示(随主轴标签间隔隐藏策略)
},
// K线图默认参数
k: {
// barWidth : null // 默认自适应
// barMaxWidth : null // 默认自适应
itemStyle: {
normal: {
color: '#fff', // 阳线填充颜色
color0: '#00aa11', // 阴线填充颜色
lineStyle: {
width: 1,
color: '#ff3200', // 阳线边框颜色
color0: '#00aa11' // 阴线边框颜色
}
},
emphasis: {
// color: 各异,
// color0: 各异
}
}
},
// 散点图默认参数
scatter: {
//symbol: null, // 图形类型
symbolSize: 4, // 图形大小,半宽(半径)参数,当图形为方向或菱形则总宽度为symbolSize * 2
//symbolRotate : null, // 图形旋转控制
large: false, // 大规模散点图
largeThreshold: 2000,// 大规模阀值,large为true且数据量>largeThreshold才启用大规模模式
itemStyle: {
normal: {
// color: 各异,
label: {
show: false
// position: 默认自适应,水平布局为'top',垂直布局为'right',可选为
// 'inside'|'left'|'right'|'top'|'bottom'
// textStyle: null // 默认使用全局文本样式,详见TEXTSTYLE
}
},
emphasis: {
// color: '各异'
label: {
show: false
// position: 默认自适应,水平布局为'top',垂直布局为'right',可选为
// 'inside'|'left'|'right'|'top'|'bottom'
// textStyle: null // 默认使用全局文本样式,详见TEXTSTYLE
}
}
}
},
// 雷达图默认参数
radar : {
itemStyle: {
normal: {
// color: 各异,
label: {
show: false
},
lineStyle: {
width: 2,
type: 'solid'
}
},
emphasis: {
// color: 各异,
label: {
show: false
}
}
},
//symbol: null, // 拐点图形类型
symbolSize: 2 // 可计算特性参数,空数据拖拽提示图形大小
//symbolRotate : null, // 图形旋转控制
},
// 饼图默认参数
pie: {
center : ['50%', '50%'], // 默认全局居中
radius : [0, '75%'],
clockWise : false, // 默认逆时针
startAngle: 90,
minAngle: 0, // 最小角度改为0
selectedOffset: 10, // 选中是扇区偏移量
itemStyle: {
normal: {
// color: 各异,
borderColor: '#fff',
borderWidth: 1,
label: {
show: true,
position: 'outer'
// textStyle: null // 默认使用全局文本样式,详见TEXTSTYLE
},
labelLine: {
show: true,
length: 20,
lineStyle: {
// color: 各异,
width: 1,
type: 'solid'
}
}
},
emphasis: {
// color: 各异,
borderColor: 'rgba(0,0,0,0)',
borderWidth: 1,
label: {
show: false
// position: 'outer'
// textStyle: null // 默认使用全局文本样式,详见TEXTSTYLE
},
labelLine: {
show: false,
length: 20,
lineStyle: {
// color: 各异,
width: 1,
type: 'solid'
}
}
}
}
},
map: {
mapType: 'china', // 各省的mapType暂时都用中文
mapLocation: {
x : 'center',
y : 'center'
// width // 自适应
// height // 自适应
},
showLegendSymbol : true, // 显示图例颜色标识(系列标识的小圆点),存在legend时生效
itemStyle: {
normal: {
// color: 各异,
borderColor: '#fff',
borderWidth: 1,
areaStyle: {
color: '#ccc'//rgba(135,206,250,0.8)
},
label: {
show: false,
textStyle: {
color: 'rgba(139,69,19,1)'
}
}
},
emphasis: { // 也是选中样式
// color: 各异,
borderColor: 'rgba(0,0,0,0)',
borderWidth: 1,
areaStyle: {
color: 'rgba(255,215,0,0.8)'
},
label: {
show: false,
textStyle: {
color: 'rgba(139,69,19,1)'
}
}
}
}
},
force : {
// 数据map到圆的半径的最小值和最大值
minRadius : 10,
maxRadius : 20,
density : 1.0,
attractiveness : 1.0,
// 初始化的随机大小位置
initSize : 300,
// 向心力因子,越大向心力越大
centripetal : 1,
// 冷却因子
coolDown : 0.99,
// 分类里如果有样式会覆盖节点默认样式
itemStyle: {
normal: {
// color: 各异,
label: {
show: false
// textStyle: null // 默认使用全局文本样式,详见TEXTSTYLE
},
nodeStyle : {
brushType : 'both',
color : '#f08c2e',
strokeColor : '#5182ab'
},
linkStyle : {
strokeColor : '#5182ab'
}
},
emphasis: {
// color: 各异,
label: {
show: false
// textStyle: null // 默认使用全局文本样式,详见TEXTSTYLE
},
nodeStyle : {},
linkStyle : {}
}
}
},
chord : {
radius : ['65%', '75%'],
center : ['50%', '50%'],
padding : 2,
sort : 'none', // can be 'none', 'ascending', 'descending'
sortSub : 'none', // can be 'none', 'ascending', 'descending'
startAngle : 90,
clockWise : false,
showScale : false,
showScaleText : false,
itemStyle : {
normal : {
label : {
show : true
// textStyle: null // 默认使用全局文本样式,详见TEXTSTYLE
},
lineStyle : {
width : 0,
color : '#000'
},
chordStyle : {
lineStyle : {
width : 1,
color : '#666'
}
}
},
emphasis : {
lineStyle : {
width : 0,
color : '#000'
},
chordStyle : {
lineStyle : {
width : 2,
color : '#333'
}
}
}
}
},
island: {
r: 15,
calculateStep: 0.1 // 滚轮可计算步长 0.1 = 10%
},
markPoint : {
symbol: 'pin', // 标注类型
symbolSize: 10, // 标注大小,半宽(半径)参数,当图形为方向或菱形则总宽度为symbolSize * 2
//symbolRotate : null, // 标注旋转控制
itemStyle: {
normal: {
// color: 各异,
// borderColor: 各异, // 标注边线颜色,优先于color
borderWidth: 2, // 标注边线线宽,单位px,默认为1
label: {
show: true,
position: 'inside' // 可选为'left'|'right'|'top'|'bottom'
// textStyle: null // 默认使用全局文本样式,详见TEXTSTYLE
}
},
emphasis: {
// color: 各异
label: {
show: true
// position: 'inside' // 'left'|'right'|'top'|'bottom'
// textStyle: null // 默认使用全局文本样式,详见TEXTSTYLE
}
}
}
},
markLine : {
// 标线起始和结束的symbol介绍类型,如果都一样,可以直接传string
symbol: ['circle', 'arrow'],
// 标线起始和结束的symbol大小,半宽(半径)参数,当图形为方向或菱形则总宽度为symbolSize * 2
symbolSize: [2, 4],
// 标线起始和结束的symbol旋转控制
//symbolRotate : null,
itemStyle: {
normal: {
// color: 各异, // 标线主色,线色,symbol主色
// borderColor: 随color, // 标线symbol边框颜色,优先于color
borderWidth: 2, // 标线symbol边框线宽,单位px,默认为2
label: {
show: false,
// 可选为 'start'|'end'|'left'|'right'|'top'|'bottom'
position: 'inside',
textStyle: { // 默认使用全局文本样式,详见TEXTSTYLE
color: '#333'
}
},
lineStyle: {
// color: 随borderColor, // 主色,线色,优先级高于borderColor和color
// width: 随borderWidth, // 优先于borderWidth
type: 'solid',
shadowColor : 'rgba(0,0,0,0)', //默认透明
shadowBlur: 5,
shadowOffsetX: 3,
shadowOffsetY: 3
}
},
emphasis: {
// color: 各异
label: {
show: false
// position: 'inside' // 'left'|'right'|'top'|'bottom'
// textStyle: null // 默认使用全局文本样式,详见TEXTSTYLE
},
lineStyle : {}
}
}
},
textStyle: {
decoration: 'none',
fontFamily: 'Arial, Verdana, sans-serif',
fontFamily2: '微软雅黑', // IE8- 字体模糊并且不支持不同字体混排,额外指定一份
fontSize: 12,
fontStyle: 'normal',
fontWeight: 'normal'
},
// 默认标志图形类型列表
symbolList : [
'circle', 'rectangle', 'triangle', 'diamond',
'emptyCircle', 'emptyRectangle', 'emptyTriangle', 'emptyDiamond'
],
loadingText : 'Loading...',
// 可计算特性配置,孤岛,提示颜色
calculable: false, // 默认关闭可计算特性
calculableColor: 'rgba(255,165,0,0.6)', // 拖拽提示边框颜色
calculableHolderColor: '#ccc', // 可计算占位提示颜色
nameConnector: ' & ',
valueConnector: ' : ',
animation: true,
animationThreshold: 2500, // 动画元素阀值,产生的图形原素超过2500不出动画
addDataAnimation: true, // 动态数据接口是否开启动画效果
animationDuration: 2000,
animationEasing: 'ExponentialOut' //BounceOut
}原文地址:https://blog.csdn.net/takobee5411/article/details/131144633
本文来自互联网用户投稿,该文观点仅代表作者本人,不代表本站立场。本站仅提供信息存储空间服务,不拥有所有权,不承担相关法律责任。
如若转载,请注明出处:http://www.7code.cn/show_14941.html
如若内容造成侵权/违法违规/事实不符,请联系代码007邮箱:suwngjj01@126.com进行投诉反馈,一经查实,立即删除!