一、业务场景:
最近在vue中使用echarts时 引入的时候怎么也引不上,后面发现需要绑定在原型上就可以完美解决(也可以直接在需要引入的页面用ES5中的require引入require(‘echarts’))
为了避免大家走弯路,下面整合了一下echarts 在vue框架中的使用步骤
二、具体实现步骤:
1、先在终端安装echarts
npm install echarts --save
2、在main.js中引入(这里分5.0以上和以下两个版本来安装)
5.0以上版本
import * as echarts from 'echarts'
5.0以下版本
import echarts from 'echarts'
vue.prototype.$echarts = echarts
<div id="main" style="width: 500px;height:400px;"></div>
init() {
//调接口
quShiPic({})
.then(res => {
console.log(res)
const { data, count, code, msg } = res
if (msg == 'success') {
this.quLineLists = data
console.log(this.quLineLists)
console.log(this.quLineLists[0].data)
console.log(this.quLineLists[1].data)
console.log(this.quLineLists[2].data)
// 基于准备好的dom,初始化echarts实例
var myChart = this.$echarts.init(
document.getElementById('main')
)
// 配置option选项
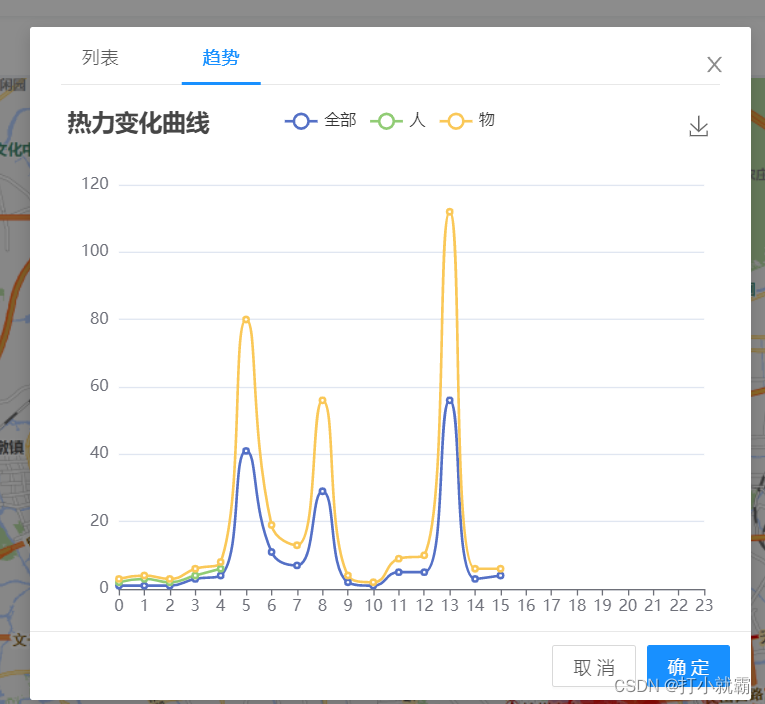
var option = {
title: {
text: '热力变化曲线'
},
tooltip: {
trigger: 'axis'
},
legend: {
data: ['全部', '人', '物']
},
grid: {
left: '3%',
right: '2%',
bottom: '3%',
containLabel: true
},
toolbox: {
feature: {
saveAsImage: {}
}
},
xAxis: {
type: 'category',
boundaryGap: false,
data: ['0', '1', '2', '3', '4', '5', '6', '7', '8', '9', '10', '11', '12', '13', '14', '15', '16', '17', '18', '19', '20', '21', '22', '23']
},
yAxis: {
type: 'value'
},
series:
[
{
name: '全部',
type: 'line',
stack: 'Total',
smooth: true,
// data: [120, 132,0, 101, 134, 90,0, 230, 210]
data: this.quLineLists[0].data
},
{
name: '人',
type: 'line',
smooth: true,
stack: 'Total',
// data: [220, 182, 191, 234, 290, 330, 310]
data: this.quLineLists[1].data
},
{
name: '物',
type: 'line',
stack: 'Total',
smooth: true,
// data: [150, 232, 201, 154, 190, 330, 410]
data: this.quLineLists[2].data
}
]
}
// 把配置option选项用js放进dom节点
myChart.setOption(option)
}
}).catch((err) => {
console.log(err)
})
},
    mounted() {
      this.init()
    },
<template>
<div>
<div id="main" style="width: 600px;height:400px;"></div>
</div>
</template>
<script>
export default {
name: 'WhiteName',
data() {
return {}
},
mounted() {
this.init()
},
methods: {
getLine() {
quShiPic({})
.then(res => {
console.log(res)
const { data, count, code, msg } = res
if (msg == 'success') {
this.quLineLists = data
console.log(this.quLineLists)
console.log(this.quLineLists[0].data)
console.log(this.quLineLists[1].data)
console.log(this.quLineLists[2].data)
// 基于准备好的dom,初始化echarts实例
var myChart = this.$echarts.init(
document.getElementById('main')
)
// 配置option选项
var option = {
title: {
text: '热力变化曲线'
},
tooltip: {
trigger: 'axis'
},
legend: {
data: ['全部', '人', '物']
},
grid: {
left: '3%',
right: '2%',
bottom: '3%',
containLabel: true
},
toolbox: {
feature: {
saveAsImage: {}
}
},
xAxis: {
type: 'category',
boundaryGap: false,
data: ['0', '1', '2', '3', '4', '5', '6', '7', '8', '9', '10', '11', '12', '13', '14', '15', '16', '17', '18', '19', '20', '21', '22', '23']
},
yAxis: {
type: 'value'
},
series:
[
{
name: '全部',
type: 'line',
stack: 'Total',
smooth: true,
// data: [120, 132,0, 101, 134, 90,0, 230, 210]
data: this.quLineLists[0].data
},
{
name: '人',
type: 'line',
smooth: true,
stack: 'Total',
// data: [220, 182, 191, 234, 290, 330, 310]
data: this.quLineLists[1].data
},
{
name: '物',
type: 'line',
stack: 'Total',
smooth: true,
// data: [150, 232, 201, 154, 190, 330, 410]
data: this.quLineLists[2].data
}
]
}
// 把配置option选项用js放进dom节点
myChart.setOption(option)
}
}).catch((err) => {
console.log(err)
})
},
}
}
}
</script>
<style scoped>
</style>
你已经成功了,撒花。
今天的分享到此结束,欢迎小伙伴们一起交流
原文地址:https://blog.csdn.net/m0_46183499/article/details/128703750
本文来自互联网用户投稿,该文观点仅代表作者本人,不代表本站立场。本站仅提供信息存储空间服务,不拥有所有权,不承担相关法律责任。
如若转载,请注明出处:http://www.7code.cn/show_41242.html
如若内容造成侵权/违法违规/事实不符,请联系代码007邮箱:suwngjj01@126.com进行投诉反馈,一经查实,立即删除!
声明:本站所有文章,如无特殊说明或标注,均为本站原创发布。任何个人或组织,在未征得本站同意时,禁止复制、盗用、采集、发布本站内容到任何网站、书籍等各类媒体平台。如若本站内容侵犯了原著者的合法权益,可联系我们进行处理。