问题:
生产环境相同的inser语句在别的非.NET程序相应明显快于.NET程序,执行时间相差比较大,影响正常业务运行,测试环境反而正常。
问题详细诊断过程
问题初步判断诊断过程:
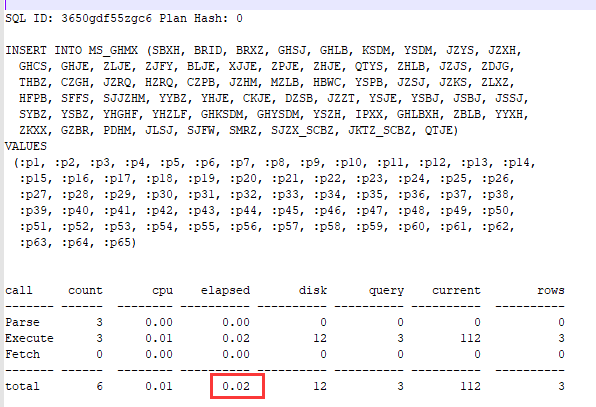
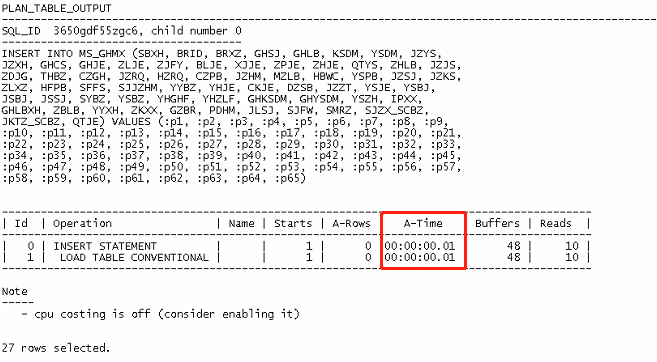
查询插入慢的sql_id
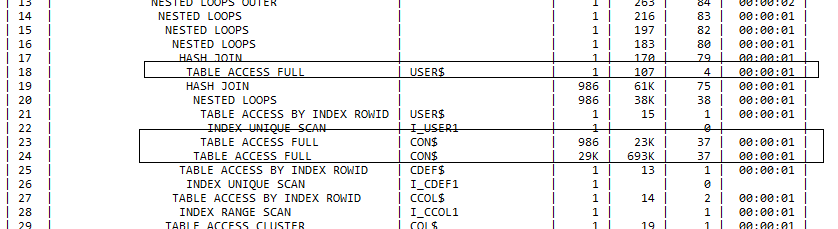
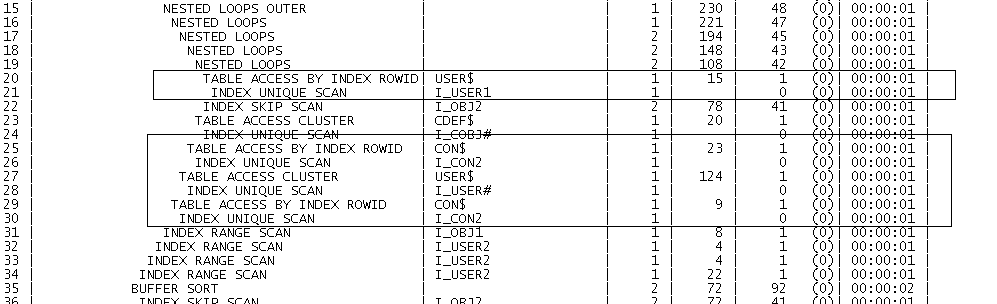
检查对应的执行计划,未发现异常,SQL A-TIME实际内部执行时间为1毫秒
使用SQL trace跟踪insert数据库内部执行情况,总时间不到12毫秒
进一步对会话进行会话跟踪
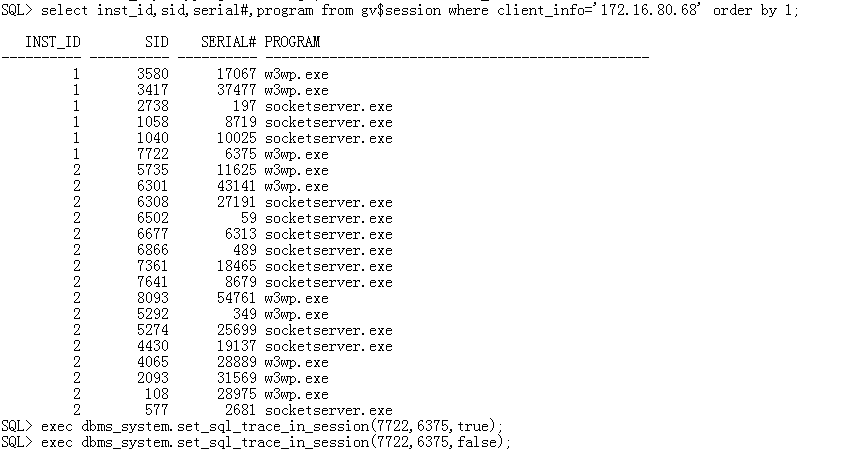
由于是3层架构,执行会话不固定,进行多次跟踪后并未发现有用信息。
检查应用服务器的等待事件信息
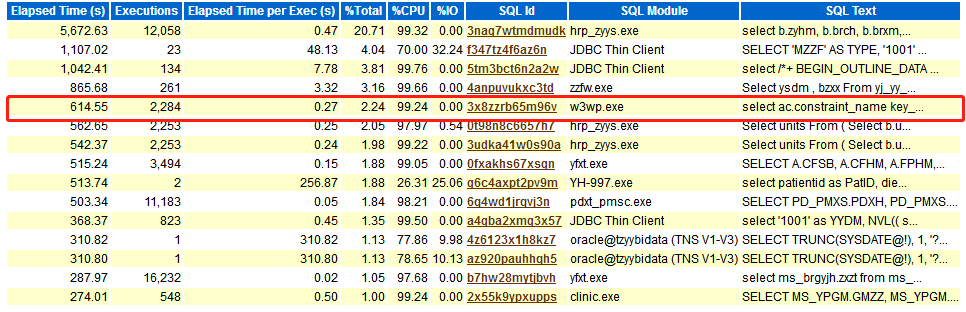
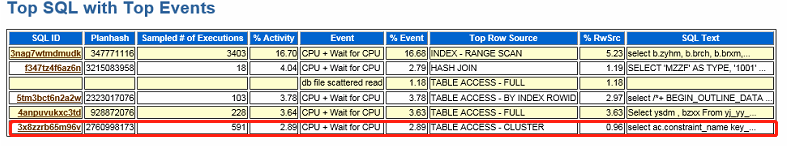
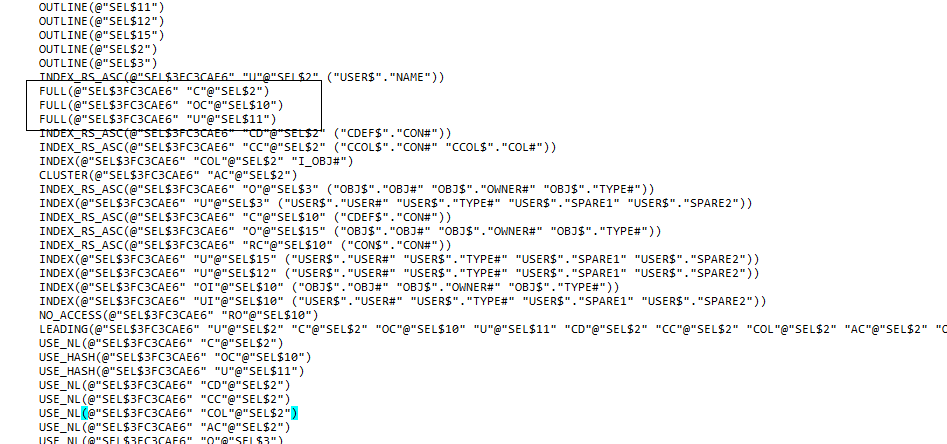
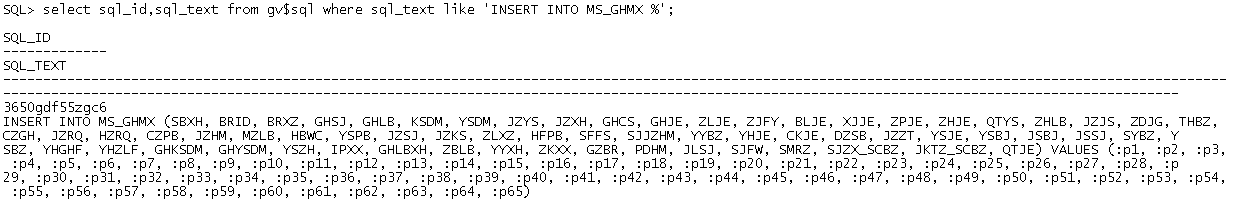
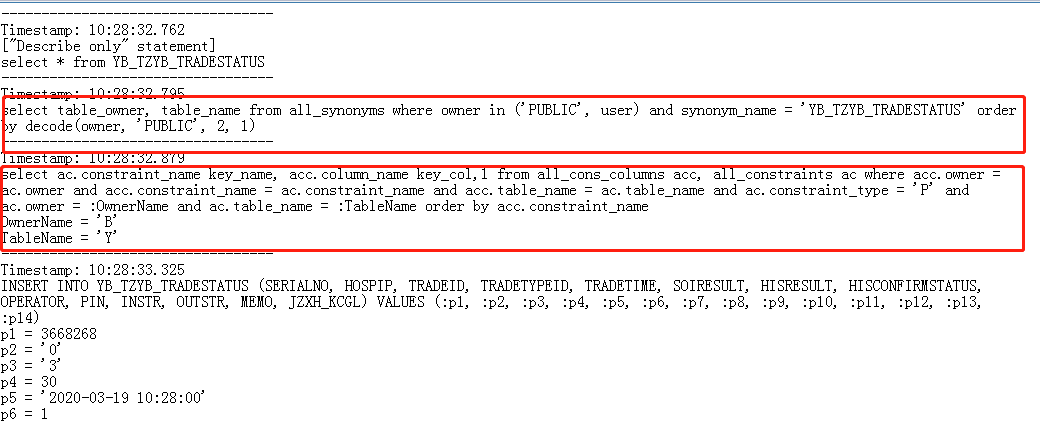
进一步使用SQL monitor跟踪客户端,发现非业务SQL语句,内容如下:
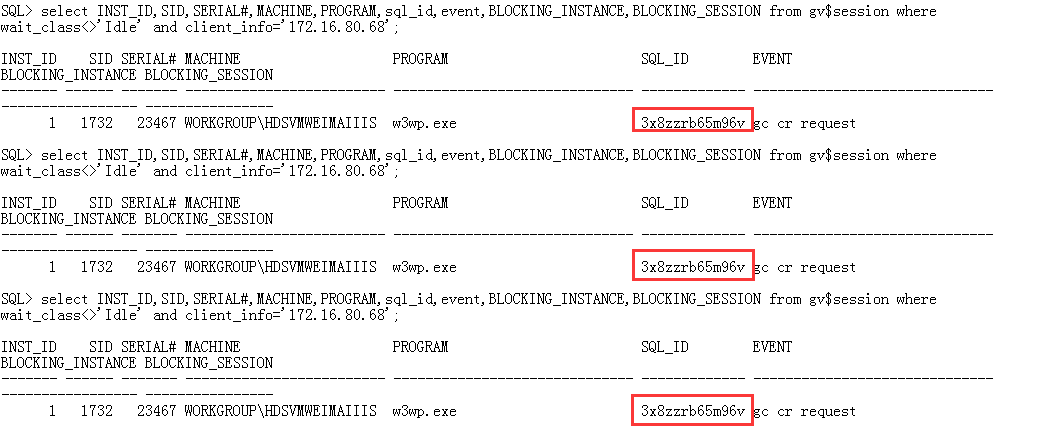
根据客户端的ip及应用程序,后台数据库查询等待语句

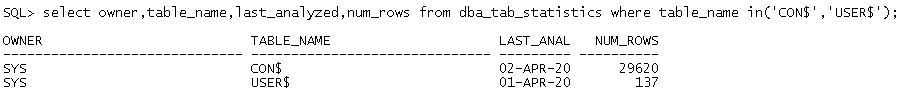
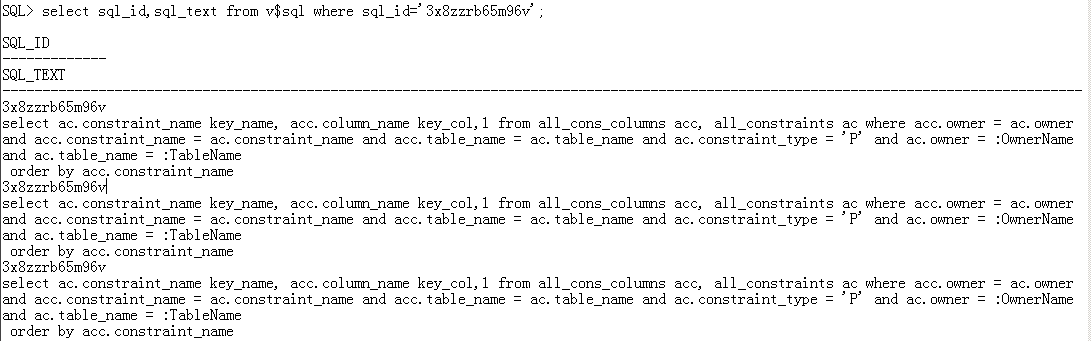
发现sql_id为’byvg6t5kz8xk0’的语句有等待现象,通过查询该sql语句
sql > select sql_text from v$sql where sql_id=‘byvg6t5kz8xk0’;
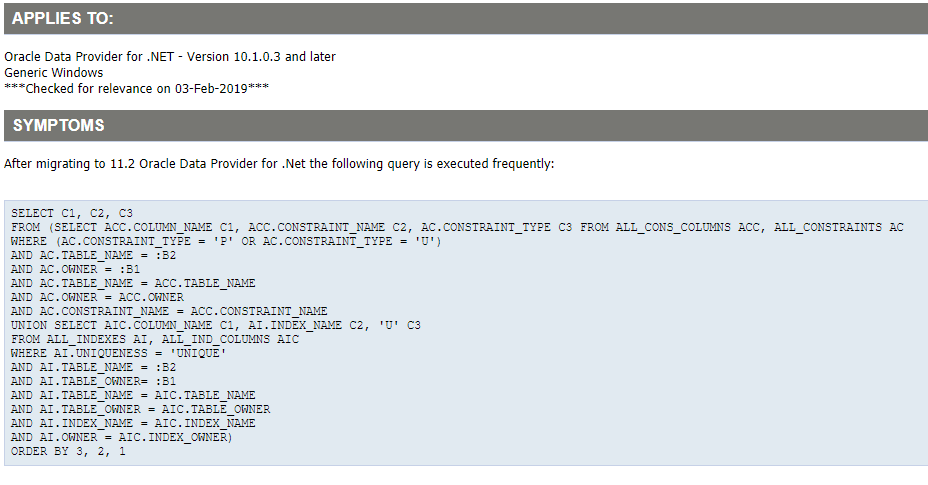
select ac.constraint_name key_name, acc.column_name key_col,:“SYS_B_0” from all_cons_columns acc, all_constraints ac where acc.owner = ac.owner and acc.constraint_name = ac.constraint_name and acc.table_name = ac.table_name and ac.constraint_type = :“SYS_B_1” and ac.owner = :OwnerName and ac.table_name = :TableName order by acc.constraint_name
比较客户端抓取的语句,发现该语句在sqlmonitor中抓取的也存在,在插入数据前面有两条查询系统表的语句,实际上应用并没有执行这两条语句。
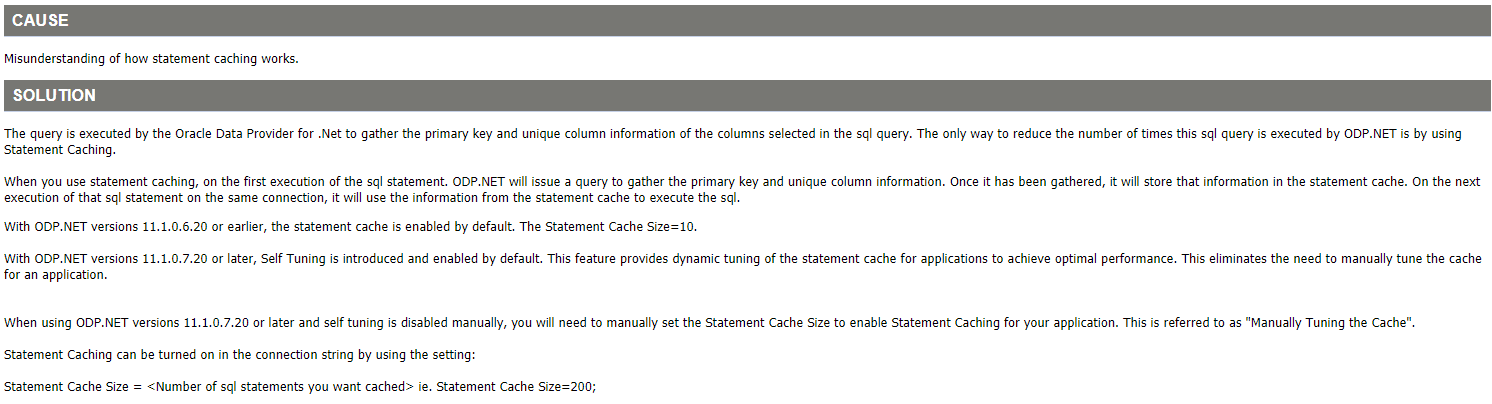
 使用
使用